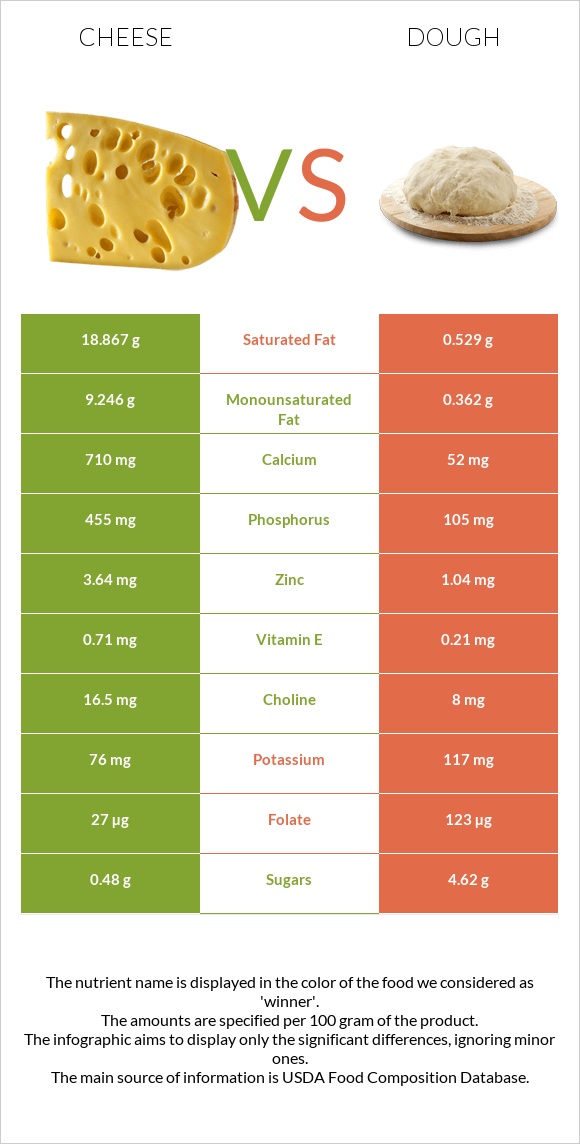
How are cheese and dough different? Cheese has more calcium, phosphorus, vitamin B12, and vitamin A; however, dough is richer in vitamin B1, iron, vitamin B3, and folate. Cheese covers your daily need for saturated fat, 92% more than dough. Dough contains less cholesterol. Dough has a higher glycemic index. The glycemic index of dough is 70, while the glycemic index of cheese is 0. Cheese, cheddar and Bread, french or vienna (includes sourdough) types were used in this article.
Infographic
Mineral Comparison
Mineral comparison score is based on the number of minerals by which one or the other food is richer. The "coverage" charts below show how much of the daily needs can be covered by 300 grams of the food.
3
100 g
300 g
1 cubic inch - 17g 1 slice (1 oz) - 28g 1 oz - 28.35g 1 cup, shredded - 113g 1 cup, diced - 132g 1 cup, melted - 244g
Magnesium
Magnesium
Calcium
Calcium
Potassium
Potassium
Iron
Iron
Copper
Copper
Zinc
Zinc
Phosphorus
Phosphorus
Sodium
Sodium
Manganese
Manganese
Selenium
Selenium
19%
213%
6.7%
5.3%
10%
99%
195%
85%
3.5%
155%
5
100 g
300 g
1 oz - 28.35g 1 slice - 139g
Magnesium
Magnesium
Calcium
Calcium
Potassium
Potassium
Iron
Iron
Copper
Copper
Zinc
Zinc
Phosphorus
Phosphorus
Sodium
Sodium
Manganese
Manganese
Selenium
Selenium
23%
16%
10%
147%
51%
28%
45%
79%
75%
156%
Vitamin Comparison
Vitamin comparison score is based on the number of vitamins by which one or the other food is richer. The "coverage" charts below show how much of the daily needs can be covered by 300 grams of the food.
5
100 g
300 g
1 cubic inch - 17g 1 slice (1 oz) - 28g 1 oz - 28.35g 1 cup, shredded - 113g 1 cup, diced - 132g 1 cup, melted - 244g
Vitamin C
Vit. C
Vitamin D
Vit. D
Vitamin A
Vit. A
Vitamin E
Vit. E
Vitamin B1
Vit. B1
Vitamin B2
Vit. B2
Vitamin B3
Vit. B3
Vitamin B5
Vit. B5
Vitamin B6
Vit. B6
Vitamin B12
Vit. B12
Vitamin K
Vit. K
Folate
Folate
0%
9%
110%
14%
7.3%
99%
1.1%
25%
15%
138%
6%
20%
5
100 g
300 g
1 oz - 28.35g 1 slice - 139g
Vitamin C
Vit. C
Vitamin D
Vit. D
Vitamin A
Vit. A
Vitamin E
Vit. E
Vitamin B1
Vit. B1
Vitamin B2
Vit. B2
Vitamin B3
Vit. B3
Vitamin B5
Vit. B5
Vitamin B6
Vit. B6
Vitamin B12
Vit. B12
Vitamin K
Vit. K
Folate
Folate
0%
0%
0%
4.2%
178%
99%
90%
27%
25%
0%
1.8%
92%
All nutrients comparison - raw data values
Nutrient
DV% diff.
Saturated fat
18.867g
0.529g
83%
Calcium
710mg
52mg
66%
Vitamin B1
0.029mg
0.71mg
57%
Phosphorus
455mg
105mg
50%
Fats
33.31g
2.42g
48%
Iron
0.14mg
3.91mg
47%
Vitamin B12
1.1µg
0µg
46%
Vitamin A
330µg
0µg
37%
Cholesterol
99mg
0mg
33%
Vitamin B3
0.059mg
4.817mg
30%
Protein
22.87g
10.75g
24%
Zinc
3.64mg
1.04mg
24%
Manganese
0.027mg
0.577mg
24%
Folate
27µg
123µg
24%
Monounsaturated fat
9.246g
0.362g
22%
Starch
44.23g
18%
Carbs
3.09g
51.88g
16%
Copper
0.03mg
0.152mg
14%
Fiber
0g
2.2g
9%
Calories
404kcal
272kcal
7%
Polyunsaturated fat
1.421g
0.855g
4%
Vitamin D*
24 IU
0 IU
3%
Vitamin D
0.6µg
0µg
3%
Vitamin E
0.71mg
0.21mg
3%
Vitamin B6
0.066mg
0.107mg
3%
Sodium
653mg
602mg
2%
Choline
16.5mg
8mg
2%
Magnesium
27mg
32mg
1%
Potassium
76mg
117mg
1%
Vitamin B5
0.41mg
0.455mg
1%
Vitamin K
2.4µg
0.7µg
1%
Fructose
0g
0.51g
1%
Protein per 100 calories
5.7g
4g
N/A
Calories per 10 g protein
177kcal
253kcal
N/A
Weight per 100 calories
25g
37g
N/A
Unsaturated / Saturated Fat ratio
0.57
2.3
N/A
Net carbs
3.09g
49.68g
N/A
Sugar
0.48g
4.62g
N/A
Selenium
28.5µg
28.6µg
0%
Vitamin B2
0.428mg
0.427mg
0%
Trans fat
0.917g
0.005g
N/A
Tryptophan
0.547mg
0%
Threonine
1.044mg
0%
Isoleucine
1.206mg
0%
Leucine
1.939mg
0%
Lysine
1.025mg
0%
Methionine
0.547mg
0%
Phenylalanine
1.074mg
0%
Valine
1.404mg
0%
Histidine
0.547mg
0%
Omega-3 - EPA
0.01g
0g
N/A
Omega-3 - DHA
0.001g
0g
N/A
Omega-3 - ALA
0.063g
N/A
Omega-3 - DPA
0.017g
0g
N/A
Omega-6 - Gamma-linoleic acid
0.001g
N/A
Omega-6 - Eicosadienoic acid
0.007g
0g
N/A
Omega-6 - Linoleic acid
0.788g
N/A
Macronutrient Comparison
Macronutrient breakdown side-by-side comparison
4
23%
33%
3%
37%
4%
Protein:
22.87 g
Fats:
33.31 g
Carbs:
3.09 g
Water:
37.02 g
Other:
3.71 g
1
11%
2%
52%
33%
2%
Protein:
10.75 g
Fats:
2.42 g
Carbs:
51.88 g
Water:
33 g
Other:
1.95 g
Contains
more
Protein Protein
+112.7%
Contains
more
Fats Fats
+1276.4%
Contains
more
Water Water
+12.2%
Contains
more
Other Other
+90.3%
Contains
more
Carbs Carbs
+1579%
Fat Type Comparison
Fat type breakdown side-by-side comparison
2
64%
31%
5%
Saturated fat:
Sat. Fat
18.867 g
Monounsaturated fat:
Mono. Fat
9.246 g
Polyunsaturated fat:
Poly. Fat
1.421 g
1
30%
21%
49%
Saturated fat:
Sat. Fat
0.529 g
Monounsaturated fat:
Mono. Fat
0.362 g
Polyunsaturated fat:
Poly. Fat
0.855 g
Contains
more
Mono. Fat Monounsaturated fat
+2454.1%
Contains
more
Poly. Fat Polyunsaturated fat
+66.2%
Contains
less
Sat. Fat Saturated fat
-97.2%
Carbohydrate type comparison
Carbohydrate type breakdown side-by-side comparison
2
54%
25%
21%
Starch:
0 g
Sucrose:
0 g
Glucose:
0.26 g
Fructose:
0 g
Lactose:
0.12 g
Maltose:
0 g
Galactose:
0.1 g
4
91%
8%
Starch:
44.23 g
Sucrose:
0 g
Glucose:
0.4 g
Fructose:
0.51 g
Lactose:
0 g
Maltose:
3.7 g
Galactose:
0 g
Contains
more
Lactose Lactose
+∞%
Contains
more
Galactose Galactose
+∞%
Contains
more
Starch Starch
+∞%
Contains
more
Glucose Glucose
+53.8%
Contains
more
Fructose Fructose
+∞%
Contains
more
Maltose Maltose
+∞%