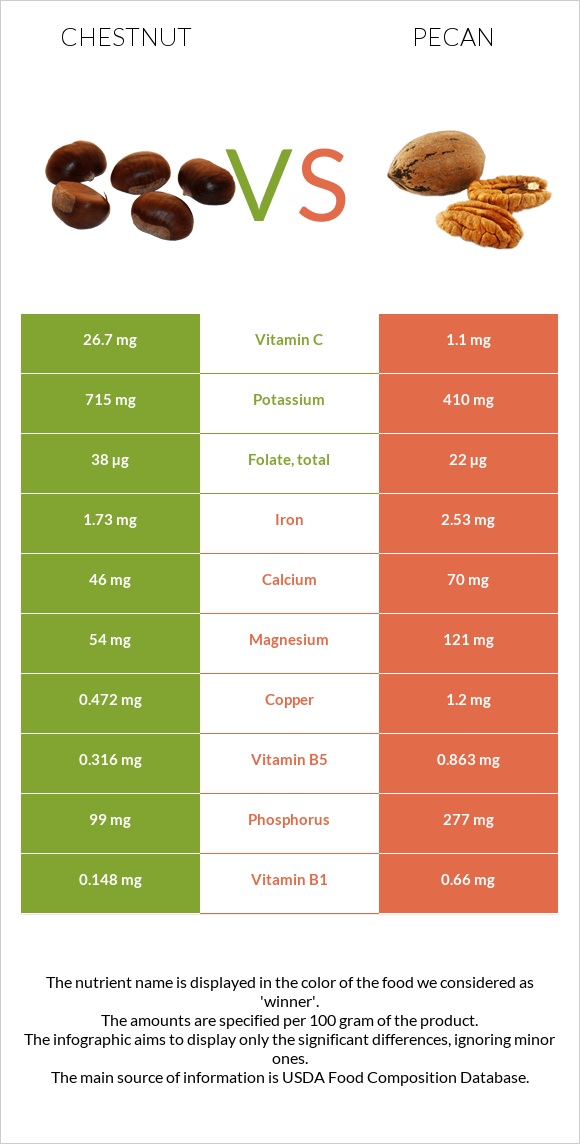
Summary of differences between chestnut and pecan Chestnut has more vitamin C, while pecan has more manganese, copper, vitamin B1, zinc, phosphorus, magnesium, vitamin B5, and iron. Pecan covers your daily need for manganese, 159% more than chestnut. Chestnut contains 24 times more vitamin C than pecan. While chestnut contains 26.7mg of vitamin C, pecan contains only 1.1mg. The amount of saturated fat in chestnut is lower. Pecan has a lower glycemic index. The glycemic index of pecan is 10, while the glycemic index of chestnut is 54. These are the specific foods used in this comparison Nuts, chestnuts, european, boiled, and steamed and Nuts, pecans .
Infographic
Mineral Comparison
Mineral comparison score is based on the number of minerals by which one or the other food is richer. The "coverage" charts below show how much of the daily needs can be covered by 300 grams of the food.
1
100 g
300 g
1 oz - 28.35g
Magnesium
Magnesium
Calcium
Calcium
Potassium
Potassium
Iron
Iron
Copper
Copper
Zinc
Zinc
Phosphorus
Phosphorus
Sodium
Sodium
Manganese
Manganese
Selenium
Selenium
39%
14%
63%
65%
157%
6.8%
42%
3.5%
111%
0%
9
100 g
300 g
1 oz (19 halves) - 28.35g 1 cup, halves - 99g 1 cup, chopped - 109g
Magnesium
Magnesium
Calcium
Calcium
Potassium
Potassium
Iron
Iron
Copper
Copper
Zinc
Zinc
Phosphorus
Phosphorus
Sodium
Sodium
Manganese
Manganese
Selenium
Selenium
86%
21%
36%
95%
400%
124%
119%
0%
587%
21%
Vitamin Comparison
Vitamin comparison score is based on the number of vitamins by which one or the other food is richer. The "coverage" charts below show how much of the daily needs can be covered by 300 grams of the food.
2
100 g
300 g
1 oz - 28.35g
Vitamin C
Vit. C
Vitamin D
Vit. D
Vitamin A
Vit. A
Vitamin E
Vit. E
Vitamin B1
Vit. B1
Vitamin B2
Vit. B2
Vitamin B3
Vit. B3
Vitamin B5
Vit. B5
Vitamin B6
Vit. B6
Vitamin B12
Vit. B12
Vitamin K
Vit. K
Folate
Folate
89%
0%
0.33%
0%
37%
24%
14%
19%
54%
0%
0%
29%
7
100 g
300 g
1 oz (19 halves) - 28.35g 1 cup, halves - 99g 1 cup, chopped - 109g
Vitamin C
Vit. C
Vitamin D
Vit. D
Vitamin A
Vit. A
Vitamin E
Vit. E
Vitamin B1
Vit. B1
Vitamin B2
Vit. B2
Vitamin B3
Vit. B3
Vitamin B5
Vit. B5
Vitamin B6
Vit. B6
Vitamin B12
Vit. B12
Vitamin K
Vit. K
Folate
Folate
3.7%
0%
1%
28%
165%
30%
22%
52%
48%
0%
8.8%
17%
All nutrients comparison - raw data values
Nutrient
DV% diff.
Manganese
0.854mg
4.5mg
159%
Polyunsaturated fat
0.545g
21.614g
140%
Fats
1.38g
71.97g
109%
Monounsaturated fat
0.476g
40.801g
101%
Copper
0.472mg
1.2mg
81%
Vitamin B1
0.148mg
0.66mg
43%
Zinc
0.25mg
4.53mg
39%
Fiber
9.6g
38%
Calories
131kcal
691kcal
28%
Vitamin C
26.7mg
1.1mg
28%
Saturated fat
0.26g
6.18g
27%
Phosphorus
99mg
277mg
25%
Magnesium
54mg
121mg
16%
Protein
2g
9.17g
14%
Vitamin B5
0.316mg
0.863mg
11%
Iron
1.73mg
2.53mg
10%
Potassium
715mg
410mg
9%
Vitamin E
1.4mg
9%
Selenium
3.8µg
7%
Choline
40.5mg
7%
Carbs
27.76g
13.86g
5%
Folate
38µg
22µg
4%
Vitamin B3
0.731mg
1.167mg
3%
Vitamin K
3.5µg
3%
Calcium
46mg
70mg
2%
Vitamin B2
0.104mg
0.13mg
2%
Vitamin B6
0.233mg
0.21mg
2%
Sodium
27mg
0mg
1%
Protein per 100 calories
1.5g
1.3g
N/A
Calories per 10 g protein
655kcal
754kcal
N/A
Weight per 100 calories
76g
14g
N/A
Unsaturated / Saturated Fat ratio
3.9
10
N/A
Net carbs
27.76g
4.26g
N/A
Sugar
3.97g
N/A
Starch
0.46g
0%
Vitamin A
1µg
3µg
0%
Tryptophan
0.022mg
0.093mg
0%
Threonine
0.071mg
0.306mg
0%
Isoleucine
0.079mg
0.336mg
0%
Leucine
0.118mg
0.598mg
0%
Lysine
0.118mg
0.287mg
0%
Methionine
0.047mg
0.183mg
0%
Phenylalanine
0.084mg
0.426mg
0%
Valine
0.112mg
0.411mg
0%
Histidine
0.055mg
0.262mg
0%
Fructose
0.04g
0%
Macronutrient Comparison
Macronutrient breakdown side-by-side comparison
2
2%
28%
68%
Protein:
2 g
Fats:
1.38 g
Carbs:
27.76 g
Water:
68.15 g
Other:
0.71 g
3
9%
72%
14%
4%
Protein:
9.17 g
Fats:
71.97 g
Carbs:
13.86 g
Water:
3.52 g
Other:
1.48 g
Contains
more
Carbs Carbs
+100.3%
Contains
more
Water Water
+1836.1%
Contains
more
Protein Protein
+358.5%
Contains
more
Fats Fats
+5115.2%
Contains
more
Other Other
+108.5%
Fat Type Comparison
Fat type breakdown side-by-side comparison
1
20%
37%
43%
Saturated fat:
Sat. Fat
0.26 g
Monounsaturated fat:
Mono. Fat
0.476 g
Polyunsaturated fat:
Poly. Fat
0.545 g
2
9%
59%
32%
Saturated fat:
Sat. Fat
6.18 g
Monounsaturated fat:
Mono. Fat
40.801 g
Polyunsaturated fat:
Poly. Fat
21.614 g
Contains
less
Sat. Fat Saturated fat
-95.8%
Contains
more
Mono. Fat Monounsaturated fat
+8471.6%
Contains
more
Poly. Fat Polyunsaturated fat
+3865.9%