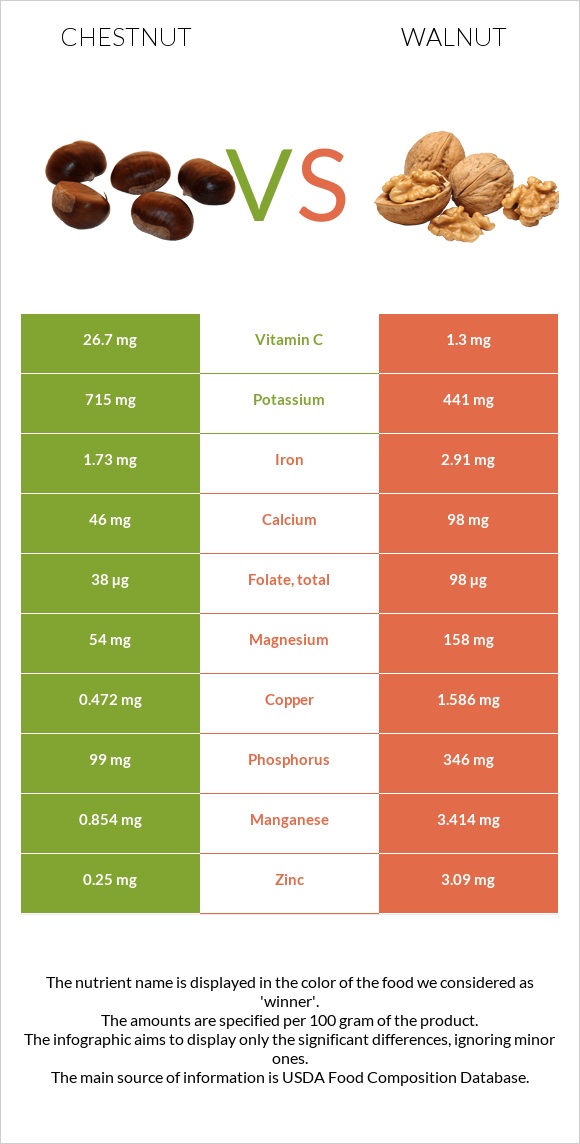
What are the main differences between chestnut and walnut? Chestnut is richer in vitamin C, yet walnut is richer in copper, manganese, phosphorus, zinc, magnesium, vitamin B6, vitamin B1, and folate. Walnut's daily need coverage for copper is 124% higher. Chestnut has 21 times more vitamin C than walnut. Chestnut has 26.7mg of vitamin C, while walnut has 1.3mg. Chestnut contains less saturated fat. Walnut has a lower glycemic index than chestnut. We used Nuts, chestnuts, european, boiled, and steamed and Nuts, walnuts, english types in this comparison.
Infographic
Mineral Comparison
Mineral comparison score is based on the number of minerals by which one or the other food is richer. The "coverage" charts below show how much of the daily needs can be covered by 300 grams of the food.
1
100 g
300 g
1 oz - 28.35g
Magnesium
Magnesium
Calcium
Calcium
Potassium
Potassium
Iron
Iron
Copper
Copper
Zinc
Zinc
Phosphorus
Phosphorus
Sodium
Sodium
Manganese
Manganese
Selenium
Selenium
39%
14%
63%
65%
157%
6.8%
42%
3.5%
111%
0%
9
100 g
300 g
1 cup, in shell, edible yield (7 nuts) - 28g 1 oz (14 halves) - 28.35g 1 cup, ground - 80g 1 cup, chopped - 117g 1 cup pieces or chips - 120g
Magnesium
Magnesium
Calcium
Calcium
Potassium
Potassium
Iron
Iron
Copper
Copper
Zinc
Zinc
Phosphorus
Phosphorus
Sodium
Sodium
Manganese
Manganese
Selenium
Selenium
113%
29%
39%
109%
529%
84%
148%
0.26%
445%
27%
Vitamin Comparison
Vitamin comparison score is based on the number of vitamins by which one or the other food is richer. The "coverage" charts below show how much of the daily needs can be covered by 300 grams of the food.
1
100 g
300 g
1 oz - 28.35g
Vitamin C
Vit. C
Vitamin D
Vit. D
Vitamin A
Vit. A
Vitamin E
Vit. E
Vitamin B1
Vit. B1
Vitamin B2
Vit. B2
Vitamin B3
Vit. B3
Vitamin B5
Vit. B5
Vitamin B6
Vit. B6
Vitamin B12
Vit. B12
Vitamin K
Vit. K
Folate
Folate
89%
0%
0.33%
0%
37%
24%
14%
19%
54%
0%
0%
29%
8
100 g
300 g
1 cup, in shell, edible yield (7 nuts) - 28g 1 oz (14 halves) - 28.35g 1 cup, ground - 80g 1 cup, chopped - 117g 1 cup pieces or chips - 120g
Vitamin C
Vit. C
Vitamin D
Vit. D
Vitamin A
Vit. A
Vitamin E
Vit. E
Vitamin B1
Vit. B1
Vitamin B2
Vit. B2
Vitamin B3
Vit. B3
Vitamin B5
Vit. B5
Vitamin B6
Vit. B6
Vitamin B12
Vit. B12
Vitamin K
Vit. K
Folate
Folate
4.3%
0%
0.33%
14%
85%
35%
21%
34%
124%
0%
6.8%
74%
All nutrients comparison - raw data values
Nutrient
DV% diff.
Polyunsaturated fat
0.545g
47.174g
311%
Copper
0.472mg
1.586mg
124%
Manganese
0.854mg
3.414mg
111%
Fats
1.38g
65.21g
98%
Phosphorus
99mg
346mg
35%
Vitamin C
26.7mg
1.3mg
28%
Fiber
6.7g
27%
Saturated fat
0.26g
6.126g
27%
Calories
131kcal
654kcal
26%
Protein
2g
15.23g
26%
Zinc
0.25mg
3.09mg
26%
Magnesium
54mg
158mg
25%
Vitamin B6
0.233mg
0.537mg
23%
Monounsaturated fat
0.476g
8.933g
21%
Vitamin B1
0.148mg
0.341mg
16%
Iron
1.73mg
2.91mg
15%
Folate
38µg
98µg
15%
Selenium
4.9µg
9%
Potassium
715mg
441mg
8%
Choline
39.2mg
7%
Carbs
27.76g
13.71g
5%
Calcium
46mg
98mg
5%
Vitamin E
0.7mg
5%
Vitamin B5
0.316mg
0.57mg
5%
Vitamin B2
0.104mg
0.15mg
4%
Vitamin B3
0.731mg
1.125mg
2%
Vitamin K
2.7µg
2%
Sodium
27mg
2mg
1%
Protein per 100 calories
1.5g
2.3g
N/A
Calories per 10 g protein
655kcal
429kcal
N/A
Weight per 100 calories
76g
15g
N/A
Unsaturated / Saturated Fat ratio
3.9
9.2
N/A
Net carbs
27.76g
7.01g
N/A
Sugar
2.61g
N/A
Starch
0.06g
0%
Vitamin A
1µg
1µg
0%
Tryptophan
0.022mg
0.17mg
0%
Threonine
0.071mg
0.596mg
0%
Isoleucine
0.079mg
0.625mg
0%
Leucine
0.118mg
1.17mg
0%
Lysine
0.118mg
0.424mg
0%
Methionine
0.047mg
0.236mg
0%
Phenylalanine
0.084mg
0.711mg
0%
Valine
0.112mg
0.753mg
0%
Histidine
0.055mg
0.391mg
0%
Fructose
0.09g
0%
Macronutrient Comparison
Macronutrient breakdown side-by-side comparison
2
2%
28%
68%
Protein:
2 g
Fats:
1.38 g
Carbs:
27.76 g
Water:
68.15 g
Other:
0.71 g
3
15%
65%
14%
4%
2%
Protein:
15.23 g
Fats:
65.21 g
Carbs:
13.71 g
Water:
4.07 g
Other:
1.78 g
Contains
more
Carbs Carbs
+102.5%
Contains
more
Water Water
+1574.4%
Contains
more
Protein Protein
+661.5%
Contains
more
Fats Fats
+4625.4%
Contains
more
Other Other
+150.7%
Fat Type Comparison
Fat type breakdown side-by-side comparison
1
20%
37%
43%
Saturated fat:
Sat. Fat
0.26 g
Monounsaturated fat:
Mono. Fat
0.476 g
Polyunsaturated fat:
Poly. Fat
0.545 g
2
10%
14%
76%
Saturated fat:
Sat. Fat
6.126 g
Monounsaturated fat:
Mono. Fat
8.933 g
Polyunsaturated fat:
Poly. Fat
47.174 g
Contains
less
Sat. Fat Saturated fat
-95.8%
Contains
more
Mono. Fat Monounsaturated fat
+1776.7%
Contains
more
Poly. Fat Polyunsaturated fat
+8555.8%