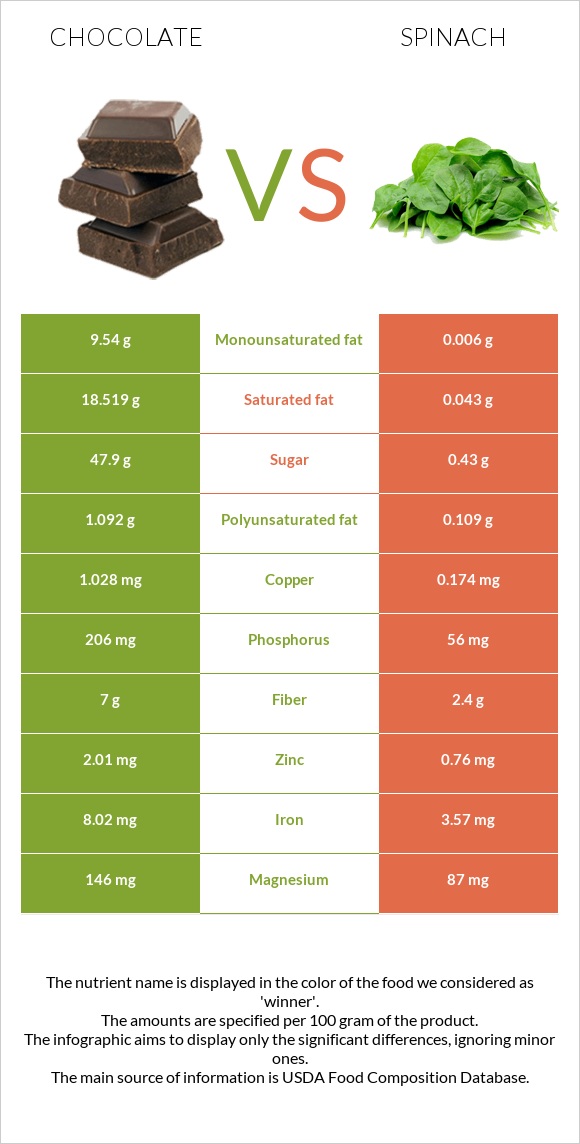
Significant differences between chocolate and spinach Chocolate has more copper, iron, phosphorus, manganese, and fiber; however, spinach is richer in vitamin K, vitamin A, vitamin B6, and vitamin B2. Spinach covers your daily vitamin K needs 405% more than chocolate. Spinach has 431 times less saturated fat than chocolate. Chocolate has 18.519g of saturated fat, while spinach has 0.043g. Specific food types used in this comparison are Chocolate, dark, 45- 59% cacao solids and Spinach, cooked, boiled, drained, without salt .
Infographic
Mineral Comparison
Mineral comparison score is based on the number of minerals by which one or the other food is richer. The "coverage" charts below show how much of the daily needs can be covered by 300 grams of the food.
9
100 g
300 g
1 oz - 28.35g 1 bar - 162g
Magnesium
Magnesium
Calcium
Calcium
Potassium
Potassium
Iron
Iron
Copper
Copper
Zinc
Zinc
Phosphorus
Phosphorus
Sodium
Sodium
Manganese
Manganese
Selenium
Selenium
104%
17%
49%
301%
343%
55%
88%
3.1%
185%
16%
1
100 g
300 g
1 cup - 180g
Magnesium
Magnesium
Calcium
Calcium
Potassium
Potassium
Iron
Iron
Copper
Copper
Zinc
Zinc
Phosphorus
Phosphorus
Sodium
Sodium
Manganese
Manganese
Selenium
Selenium
62%
41%
41%
134%
58%
21%
24%
9.1%
122%
8.2%
Vitamin Comparison
Vitamin comparison score is based on the number of vitamins by which one or the other food is richer. The "coverage" charts below show how much of the daily needs can be covered by 300 grams of the food.
3
100 g
300 g
1 oz - 28.35g 1 bar - 162g
Vitamin C
Vit. C
Vitamin D
Vit. D
Vitamin A
Vit. A
Vitamin E
Vit. E
Vitamin B1
Vit. B1
Vitamin B2
Vit. B2
Vitamin B3
Vit. B3
Vitamin B5
Vit. B5
Vitamin B6
Vit. B6
Vitamin B12
Vit. B12
Vitamin K
Vit. K
Folate
Folate
0%
0%
0.67%
11%
6.3%
12%
14%
18%
9.7%
29%
20%
0%
8
100 g
300 g
1 cup - 180g
Vitamin C
Vit. C
Vitamin D
Vit. D
Vitamin A
Vit. A
Vitamin E
Vit. E
Vitamin B1
Vit. B1
Vitamin B2
Vit. B2
Vitamin B3
Vit. B3
Vitamin B5
Vit. B5
Vitamin B6
Vit. B6
Vitamin B12
Vit. B12
Vitamin K
Vit. K
Folate
Folate
33%
0%
175%
42%
24%
54%
9.2%
8.7%
56%
0%
1234%
110%
All nutrients comparison - raw data values
Nutrient
DV% diff.
Vitamin K
8.1µg
493.6µg
405%
Copper
1.028mg
0.174mg
95%
Saturated fat
18.519g
0.043g
84%
Vitamin A
2µg
524µg
58%
Iron
8.02mg
3.57mg
56%
Fats
31.28g
0.26g
48%
Folate
146µg
37%
Calories
546kcal
23kcal
26%
Monounsaturated fat
9.54g
0.006g
24%
Phosphorus
206mg
56mg
21%
Manganese
1.419mg
0.935mg
21%
Carbs
61.17g
3.75g
19%
Fiber
7g
2.4g
18%
Vitamin B6
0.042mg
0.242mg
15%
Magnesium
146mg
87mg
14%
Vitamin B2
0.05mg
0.236mg
14%
Vitamin C
9.8mg
11%
Zinc
2.01mg
0.76mg
11%
Caffeine
43mg
0mg
11%
Vitamin E
0.54mg
2.08mg
10%
Vitamin B12
0.23µg
0µg
10%
Calcium
56mg
136mg
8%
Polyunsaturated fat
1.092g
0.109g
7%
Vitamin B1
0.025mg
0.095mg
6%
Protein
4.88g
2.97g
4%
Choline
19.7mg
4%
Cholesterol
8mg
0mg
3%
Potassium
559mg
466mg
3%
Selenium
3µg
1.5µg
3%
Vitamin B5
0.297mg
0.145mg
3%
Sodium
24mg
70mg
2%
Vitamin B3
0.725mg
0.49mg
1%
Protein per 100 calories
0.89g
13g
N/A
Calories per 10 g protein
1119kcal
77kcal
N/A
Weight per 100 calories
18g
435g
N/A
Unsaturated / Saturated Fat ratio
0.57
2.7
N/A
Net carbs
54.17g
1.35g
N/A
Sugar
47.9g
0.43g
N/A
Trans fat
0.112g
0g
N/A
Tryptophan
0.04mg
0%
Threonine
0.127mg
0%
Isoleucine
0.152mg
0%
Leucine
0.231mg
0%
Lysine
0.182mg
0%
Methionine
0.055mg
0%
Phenylalanine
0.134mg
0%
Valine
0.168mg
0%
Histidine
0.066mg
0%
Omega-3 - EPA
0.001g
0g
N/A
Omega-3 - ALA
0.085g
N/A
Omega-6 - Eicosadienoic acid
0.001g
N/A
Omega-6 - Linoleic acid
0.947g
N/A
Macronutrient Comparison
Macronutrient breakdown side-by-side comparison
3
5%
31%
61%
2%
Protein:
4.88 g
Fats:
31.28 g
Carbs:
61.17 g
Water:
0.97 g
Other:
1.7 g
2
3%
4%
91%
2%
Protein:
2.97 g
Fats:
0.26 g
Carbs:
3.75 g
Water:
91.21 g
Other:
1.81 g
Contains
more
Protein Protein
+64.3%
Contains
more
Fats Fats
+11930.8%
Contains
more
Carbs Carbs
+1531.2%
Contains
more
Water Water
+9303.1%
Fat Type Comparison
Fat type breakdown side-by-side comparison
2
64%
33%
4%
Saturated fat:
Sat. Fat
18.519 g
Monounsaturated fat:
Mono. Fat
9.54 g
Polyunsaturated fat:
Poly. Fat
1.092 g
1
27%
4%
69%
Saturated fat:
Sat. Fat
0.043 g
Monounsaturated fat:
Mono. Fat
0.006 g
Polyunsaturated fat:
Poly. Fat
0.109 g
Contains
more
Mono. Fat Monounsaturated fat
+158900%
Contains
more
Poly. Fat Polyunsaturated fat
+901.8%
Contains
less
Sat. Fat Saturated fat
-99.8%