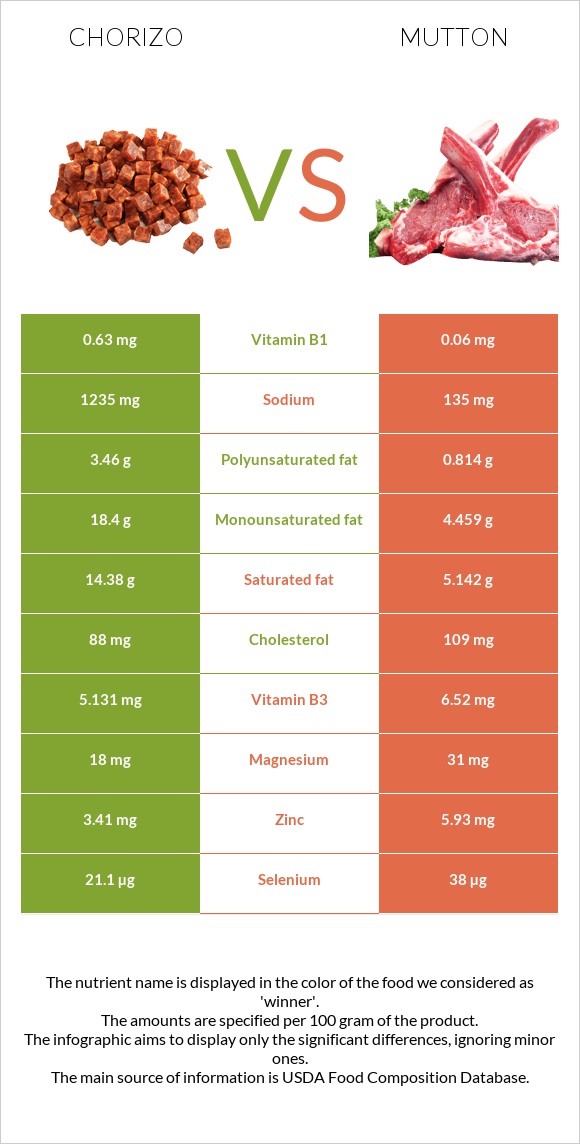
Significant differences between chorizo and mutton Chorizo has more vitamin B1 and vitamin B6; however, mutton is richer in vitamin B12, iron, selenium, zinc, phosphorus, and vitamin B3. Mutton covers your daily vitamin B12 needs 102% more than chorizo. Mutton has 11 times less vitamin B1 than chorizo. Chorizo has 0.63mg of vitamin B1, while mutton has 0.06mg. Mutton contains less sodium. Chorizo has a higher glycemic index. The glycemic index of chorizo is 28, while the glycemic index of mutton is 0. Specific food types used in this comparison are Chorizo, pork, and beef and Mutton, cooked, roasted (Navajo) .
Infographic
Mineral Comparison
Mineral comparison score is based on the number of minerals by which one or the other food is richer. The "coverage" charts below show how much of the daily needs can be covered by 300 grams of the food.
2
100 g
300 g
1 oz - 28.35g 1 link (4" long) - 60g
Magnesium
Magnesium
Calcium
Calcium
Potassium
Potassium
Iron
Iron
Copper
Copper
Zinc
Zinc
Phosphorus
Phosphorus
Sodium
Sodium
Manganese
Manganese
Selenium
Selenium
13%
2.4%
35%
60%
27%
93%
64%
161%
5.2%
115%
7
100 g
300 g
1 oz - 28.35g
Magnesium
Magnesium
Calcium
Calcium
Potassium
Potassium
Iron
Iron
Copper
Copper
Zinc
Zinc
Phosphorus
Phosphorus
Sodium
Sodium
Manganese
Manganese
Selenium
Selenium
22%
3%
36%
179%
21%
162%
117%
18%
4.3%
207%
Vitamin Comparison
Vitamin comparison score is based on the number of vitamins by which one or the other food is richer. The "coverage" charts below show how much of the daily needs can be covered by 300 grams of the food.
6
100 g
300 g
1 oz - 28.35g 1 link (4" long) - 60g
Vitamin C
Vit. C
Vitamin D
Vit. D
Vitamin A
Vit. A
Vitamin E
Vit. E
Vitamin B1
Vit. B1
Vitamin B2
Vit. B2
Vitamin B3
Vit. B3
Vitamin B5
Vit. B5
Vitamin B6
Vit. B6
Vitamin B12
Vit. B12
Vitamin K
Vit. K
Folate
Folate
0%
23%
0%
4.4%
158%
69%
96%
67%
122%
250%
4%
1.5%
3
100 g
300 g
1 oz - 28.35g
Vitamin C
Vit. C
Vitamin D
Vit. D
Vitamin A
Vit. A
Vitamin E
Vit. E
Vitamin B1
Vit. B1
Vitamin B2
Vit. B2
Vitamin B3
Vit. B3
Vitamin B5
Vit. B5
Vitamin B6
Vit. B6
Vitamin B12
Vit. B12
Vitamin K
Vit. K
Folate
Folate
0%
0%
0%
16%
15%
69%
122%
54%
87%
555%
0%
0%
All nutrients comparison - raw data values
Nutrient
DV% diff.
Vitamin B12
2µg
4.44µg
102%
Sodium
1235mg
135mg
48%
Vitamin B1
0.63mg
0.06mg
48%
Fats
38.27g
11.09g
42%
Saturated fat
14.38g
5.142g
42%
Iron
1.59mg
4.76mg
40%
Monounsaturated fat
18.4g
4.459g
35%
Selenium
21.1µg
38µg
31%
Zinc
3.41mg
5.93mg
23%
Protein
24.1g
33.43g
19%
Polyunsaturated fat
3.46g
0.814g
18%
Phosphorus
150mg
272mg
17%
Vitamin B6
0.53mg
0.377mg
12%
Calories
455kcal
234kcal
11%
Vitamin B3
5.131mg
6.52mg
9%
Vitamin D*
61 IU
8%
Vitamin D
1.5µg
8%
Cholesterol
88mg
109mg
7%
Vitamin E
0.22mg
0.8mg
4%
Vitamin B5
1.12mg
0.897mg
4%
Magnesium
18mg
31mg
3%
Copper
0.08mg
0.062mg
2%
Carbs
1.86g
0.08g
1%
Vitamin K
1.6µg
1%
Folate
2µg
0µg
1%
Choline
96.7mg
100.6mg
1%
Protein per 100 calories
5.3g
14g
N/A
Calories per 10 g protein
189kcal
70kcal
N/A
Weight per 100 calories
22g
43g
N/A
Unsaturated / Saturated Fat ratio
1.5
1
N/A
Net carbs
1.86g
0.08g
N/A
Calcium
8mg
10mg
0%
Potassium
398mg
409mg
0%
Manganese
0.04mg
0.033mg
0%
Vitamin B2
0.3mg
0.3mg
0%
Tryptophan
0.278mg
0.257mg
0%
Threonine
1.473mg
1.403mg
0%
Isoleucine
2.206mg
1.588mg
0%
Leucine
1.708mg
2.764mg
0%
Lysine
2.414mg
2.999mg
0%
Methionine
0.47mg
0.918mg
0%
Phenylalanine
1.149mg
1.399mg
0%
Valine
0.914mg
1.678mg
0%
Histidine
0.721mg
0.975mg
0%
Omega-3 - ALA
0.147g
N/A
Omega-6 - Gamma-linoleic acid
0.025g
N/A
Macronutrient Comparison
Macronutrient breakdown side-by-side comparison
3
24%
38%
2%
32%
4%
Protein:
24.1 g
Fats:
38.27 g
Carbs:
1.86 g
Water:
31.85 g
Other:
3.92 g
2
33%
11%
54%
Protein:
33.43 g
Fats:
11.09 g
Carbs:
0.08 g
Water:
54 g
Other:
1.4 g
Contains
more
Fats Fats
+245.1%
Contains
more
Carbs Carbs
+2225%
Contains
more
Other Other
+180%
Contains
more
Protein Protein
+38.7%
Contains
more
Water Water
+69.5%
Fat Type Comparison
Fat type breakdown side-by-side comparison
2
40%
51%
10%
Saturated fat:
Sat. Fat
14.38 g
Monounsaturated fat:
Mono. Fat
18.4 g
Polyunsaturated fat:
Poly. Fat
3.46 g
1
49%
43%
8%
Saturated fat:
Sat. Fat
5.142 g
Monounsaturated fat:
Mono. Fat
4.459 g
Polyunsaturated fat:
Poly. Fat
0.814 g
Contains
more
Mono. Fat Monounsaturated fat
+312.6%
Contains
more
Poly. Fat Polyunsaturated fat
+325.1%
Contains
less
Sat. Fat Saturated fat
-64.2%