Summary of differences between coffee and Red Bull Coffee has less vitamin B6, vitamin B12, vitamin B3, and vitamin B5 than Red Bull. Red Bull covers your daily need for vitamin B6, 167% more than coffee. Coffee has 16 times more potassium than Red Bull. While coffee has 49mg of potassium, Red Bull has only 3mg. These are the specific foods used in this comparison Beverages, coffee, brewed, prepared with tap water and Beverages, Energy drink, RED BULL .
Infographic
Mineral Comparison
Mineral comparison score is based on the number of minerals by which one or the other food is richer. The "coverage" charts below show how much of the daily needs can be covered by 300 grams of the food.
5
100 g
300 g
1 fl oz - 29.6g 6 fl oz - 178g 1 cup (8 fl oz) - 237g
Magnesium
Magnesium
Calcium
Calcium
Potassium
Potassium
Iron
Iron
Copper
Copper
Zinc
Zinc
Phosphorus
Phosphorus
Sodium
Sodium
Manganese
Manganese
Selenium
Selenium
2.1%
0.6%
4.3%
0.38%
0.67%
0.55%
1.3%
0.26%
3%
0%
4
100 g
300 g
1 can 8.4 fl oz - 258g 1 serving 12 fl oz - 369g 1 serving 16 fl oz - 492g
Magnesium
Magnesium
Calcium
Calcium
Potassium
Potassium
Iron
Iron
Copper
Copper
Zinc
Zinc
Phosphorus
Phosphorus
Sodium
Sodium
Manganese
Manganese
Selenium
Selenium
14%
1.8%
0.26%
2.3%
0.67%
0.27%
0%
5.1%
0.65%
1.1%
Vitamin Comparison
Vitamin comparison score is based on the number of vitamins by which one or the other food is richer. The "coverage" charts below show how much of the daily needs can be covered by 300 grams of the food.
3
100 g
300 g
1 fl oz - 29.6g 6 fl oz - 178g 1 cup (8 fl oz) - 237g
Vitamin C
Vit. C
Vitamin D
Vit. D
Vitamin A
Vit. A
Vitamin E
Vit. E
Vitamin B1
Vit. B1
Vitamin B2
Vit. B2
Vitamin B3
Vit. B3
Vitamin B5
Vit. B5
Vitamin B6
Vit. B6
Vitamin B12
Vit. B12
Vitamin K
Vit. K
Folate
Folate
0%
0%
0%
0.2%
3.5%
18%
3.6%
15%
0.23%
0%
0.25%
1.5%
6
100 g
300 g
1 can 8.4 fl oz - 258g 1 serving 12 fl oz - 369g 1 serving 16 fl oz - 492g
Vitamin C
Vit. C
Vitamin D
Vit. D
Vitamin A
Vit. A
Vitamin E
Vit. E
Vitamin B1
Vit. B1
Vitamin B2
Vit. B2
Vitamin B3
Vit. B3
Vitamin B5
Vit. B5
Vitamin B6
Vit. B6
Vitamin B12
Vit. B12
Vitamin K
Vit. K
Folate
Folate
0%
0%
0%
0%
10%
24%
184%
92%
500%
246%
0%
0%
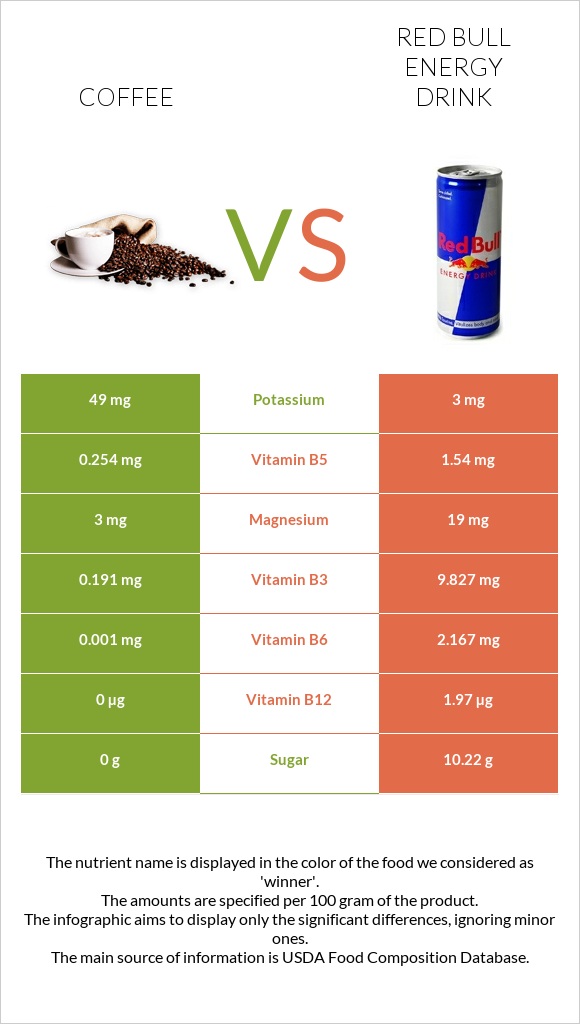
All nutrients comparison - raw data values
Nutrient
DV% diff.
Vitamin B6
0.001mg
2.167mg
167%
Vitamin B12
0µg
1.97µg
82%
Vitamin B3
0.191mg
9.827mg
60%
Vitamin B5
0.254mg
1.54mg
26%
Magnesium
3mg
19mg
4%
Carbs
0g
10.23g
3%
Caffeine
40mg
29mg
3%
Calories
1kcal
43kcal
2%
Sodium
2mg
39mg
2%
Vitamin B1
0.014mg
0.04mg
2%
Vitamin B2
0.076mg
0.103mg
2%
Fructose
0g
1.63g
2%
Protein
0.12g
0.46g
1%
Potassium
49mg
3mg
1%
Iron
0.01mg
0.06mg
1%
Manganese
0.023mg
0.005mg
1%
Folate
2µg
0µg
1%
Protein per 100 calories
12g
1.1g
N/A
Calories per 10 g protein
83kcal
935kcal
N/A
Weight per 100 calories
10000g
233g
N/A
Fats
0.02g
0g
0%
Net carbs
0g
10.23g
N/A
Calcium
2mg
6mg
0%
Sugar
0g
10.22g
N/A
Copper
0.002mg
0.002mg
0%
Zinc
0.02mg
0.01mg
0%
Phosphorus
3mg
0mg
0%
Vitamin E
0.01mg
0mg
0%
Selenium
0µg
0.2µg
0%
Vitamin K
0.1µg
0µg
0%
Choline
2.6mg
0.3mg
0%
Saturated fat
0.002g
0g
0%
Monounsaturated fat
0.015g
0g
0%
Polyunsaturated fat
0.001g
0g
0%
Threonine
0.001mg
0%
Isoleucine
0.002mg
0%
Leucine
0.005mg
0%
Lysine
0.001mg
0%
Phenylalanine
0.003mg
0%
Valine
0.003mg
0%
Histidine
0.002mg
0%
Macronutrient Comparison
Macronutrient breakdown side-by-side comparison
3
99%
Protein:
0.12 g
Fats:
0.02 g
Carbs:
0 g
Water:
99.39 g
Other:
0.47 g
2
10%
89%
Protein:
0.46 g
Fats:
0 g
Carbs:
10.23 g
Water:
89.22 g
Other:
0.09 g
Contains
more
Fats Fats
+∞%
Contains
more
Water Water
+11.4%
Contains
more
Other Other
+422.2%
Contains
more
Protein Protein
+283.3%
Contains
more
Carbs Carbs
+∞%