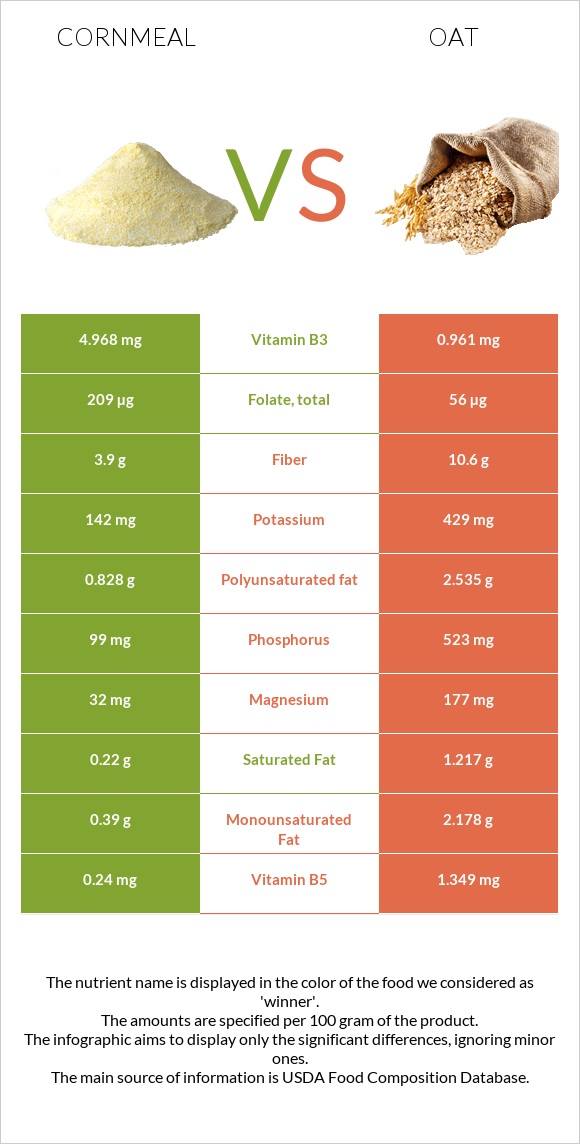
Significant differences between cornmeal and oats Cornmeal has more folate, vitamin B3, and vitamin B2; however, oats are richer in manganese, copper, phosphorus, magnesium, zinc, fiber, and vitamin B5. Oats cover your daily manganese needs 206% more than cornmeal. Oats have 5 times less vitamin B3 than cornmeal. Cornmeal has 4.968mg of vitamin B3, while oats have 0.961mg. Specific food types used in this comparison are Cornmeal, degermed, enriched, yellow and Oats .
Infographic
Mineral Comparison
Mineral comparison score is based on the number of minerals by which one or the other food is richer. The "coverage" charts below show how much of the daily needs can be covered by 300 grams of the food.
1
100 g
300 g
1 cup - 157g
Magnesium
Magnesium
Calcium
Calcium
Potassium
Potassium
Iron
Iron
Copper
Copper
Zinc
Zinc
Phosphorus
Phosphorus
Sodium
Sodium
Manganese
Manganese
Selenium
Selenium
23%
0.9%
13%
164%
25%
18%
42%
0.91%
23%
57%
8
100 g
300 g
1 cup - 156g
Magnesium
Magnesium
Calcium
Calcium
Potassium
Potassium
Iron
Iron
Copper
Copper
Zinc
Zinc
Phosphorus
Phosphorus
Sodium
Sodium
Manganese
Manganese
Selenium
Selenium
126%
16%
38%
177%
209%
108%
224%
0.26%
641%
0%
Vitamin Comparison
Vitamin comparison score is based on the number of vitamins by which one or the other food is richer. The "coverage" charts below show how much of the daily needs can be covered by 300 grams of the food.
6
100 g
300 g
1 cup - 157g
Vitamin C
Vit. C
Vitamin D
Vit. D
Vitamin A
Vit. A
Vitamin E
Vit. E
Vitamin B1
Vit. B1
Vitamin B2
Vit. B2
Vitamin B3
Vit. B3
Vitamin B5
Vit. B5
Vitamin B6
Vit. B6
Vitamin B12
Vit. B12
Vitamin K
Vit. K
Folate
Folate
0%
0%
3.7%
2.4%
138%
88%
93%
14%
42%
0%
0%
157%
2
100 g
300 g
1 cup - 156g
Vitamin C
Vit. C
Vitamin D
Vit. D
Vitamin A
Vit. A
Vitamin E
Vit. E
Vitamin B1
Vit. B1
Vitamin B2
Vit. B2
Vitamin B3
Vit. B3
Vitamin B5
Vit. B5
Vitamin B6
Vit. B6
Vitamin B12
Vit. B12
Vitamin K
Vit. K
Folate
Folate
0%
0%
0%
0%
191%
32%
18%
81%
27%
0%
0%
42%
All nutrients comparison - raw data values
Nutrient
DV% diff.
Manganese
0.174mg
4.916mg
206%
Copper
0.076mg
0.626mg
61%
Phosphorus
99mg
523mg
61%
Folate
209µg
56µg
38%
Magnesium
32mg
177mg
35%
Zinc
0.66mg
3.97mg
30%
Starch
73.3g
30%
Fiber
3.9g
10.6g
27%
Vitamin B3
4.968mg
0.961mg
25%
Vitamin B5
0.24mg
1.349mg
22%
Protein
7.11g
16.89g
20%
Selenium
10.5µg
19%
Vitamin B2
0.382mg
0.139mg
19%
Vitamin B1
0.551mg
0.763mg
18%
Polyunsaturated fat
0.828g
2.535g
11%
Fats
1.75g
6.9g
8%
Potassium
142mg
429mg
8%
Calcium
3mg
54mg
5%
Vitamin B6
0.182mg
0.119mg
5%
Saturated fat
0.22g
1.217g
5%
Carbs
79.45g
66.27g
4%
Iron
4.36mg
4.72mg
4%
Monounsaturated fat
0.39g
2.178g
4%
Choline
8.6mg
2%
Calories
370kcal
389kcal
1%
Vitamin A
11µg
0µg
1%
Vitamin E
0.12mg
1%
Protein per 100 calories
1.9g
4.3g
N/A
Calories per 10 g protein
520kcal
230kcal
N/A
Weight per 100 calories
27g
26g
N/A
Unsaturated / Saturated Fat ratio
5.5
3.9
N/A
Net carbs
75.55g
55.67g
N/A
Sugar
1.61g
N/A
Sodium
7mg
2mg
0%
Tryptophan
0.038mg
0.234mg
0%
Threonine
0.172mg
0.575mg
0%
Isoleucine
0.242mg
0.694mg
0%
Leucine
1.006mg
1.284mg
0%
Lysine
0.105mg
0.701mg
0%
Methionine
0.162mg
0.312mg
0%
Phenylalanine
0.366mg
0.895mg
0%
Valine
0.337mg
0.937mg
0%
Histidine
0.172mg
0.405mg
0%
Fructose
0.17g
0%
Macronutrient Comparison
Macronutrient breakdown side-by-side comparison
2
7%
2%
79%
11%
Protein:
7.11 g
Fats:
1.75 g
Carbs:
79.45 g
Water:
11.18 g
Other:
0.51 g
3
17%
7%
66%
8%
2%
Protein:
16.89 g
Fats:
6.9 g
Carbs:
66.27 g
Water:
8.22 g
Other:
1.72 g
Contains
more
Carbs Carbs
+19.9%
Contains
more
Water Water
+36%
Contains
more
Protein Protein
+137.6%
Contains
more
Fats Fats
+294.3%
Contains
more
Other Other
+237.3%
Fat Type Comparison
Fat type breakdown side-by-side comparison
1
15%
27%
58%
Saturated fat:
Sat. Fat
0.22 g
Monounsaturated fat:
Mono. Fat
0.39 g
Polyunsaturated fat:
Poly. Fat
0.828 g
2
21%
37%
43%
Saturated fat:
Sat. Fat
1.217 g
Monounsaturated fat:
Mono. Fat
2.178 g
Polyunsaturated fat:
Poly. Fat
2.535 g
Contains
less
Sat. Fat Saturated fat
-81.9%
Contains
more
Mono. Fat Monounsaturated fat
+458.5%
Contains
more
Poly. Fat Polyunsaturated fat
+206.2%