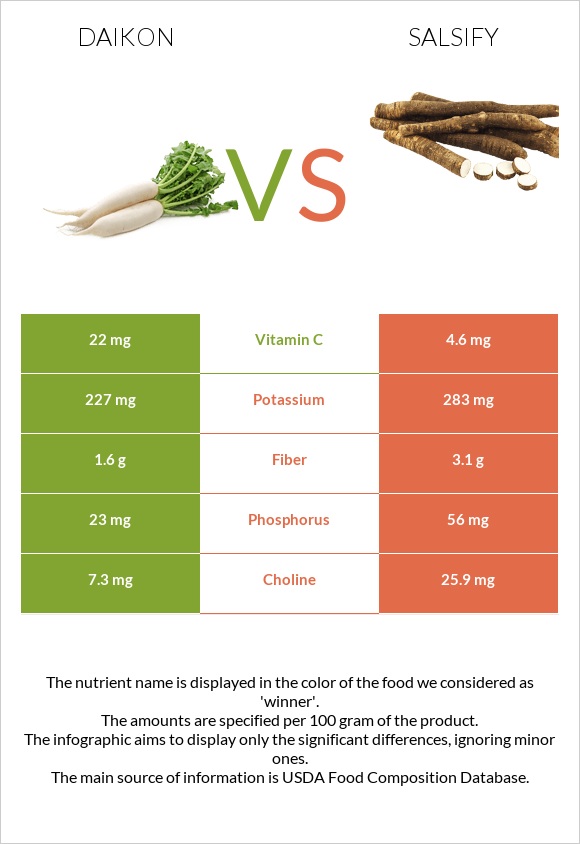
How are daikon and salsify different? Daikon is richer in vitamin C and copper, while salsify is higher in vitamin B6, vitamin B2, manganese, and fiber. Daikon covers your daily need for vitamin C, 19% more than salsify. Daikon contains 2 times more copper than salsify. Daikon contains 0.115mg of copper, while salsify contains 0.07mg. Radishes, oriental, raw and Salsify, cooked, boiled, drained, without salt types were used in this article.
Infographic
Mineral Comparison
Mineral comparison score is based on the number of minerals by which one or the other food is richer. The "coverage" charts below show how much of the daily needs can be covered by 300 grams of the food.
2
100 g
300 g
1 cup slices - 116g 1 radish (7" long) - 338g
Magnesium
Magnesium
Calcium
Calcium
Potassium
Potassium
Iron
Iron
Copper
Copper
Zinc
Zinc
Phosphorus
Phosphorus
Sodium
Sodium
Manganese
Manganese
Selenium
Selenium
11%
8.1%
20%
15%
38%
4.1%
9.9%
2.7%
5%
3.8%
8
100 g
300 g
1 cup, sliced - 135g
Magnesium
Magnesium
Calcium
Calcium
Potassium
Potassium
Iron
Iron
Copper
Copper
Zinc
Zinc
Phosphorus
Phosphorus
Sodium
Sodium
Manganese
Manganese
Selenium
Selenium
13%
14%
25%
21%
23%
8.2%
24%
2.1%
27%
3.3%
Vitamin Comparison
Vitamin comparison score is based on the number of vitamins by which one or the other food is richer. The "coverage" charts below show how much of the daily needs can be covered by 300 grams of the food.
2
100 g
300 g
1 cup slices - 116g 1 radish (7" long) - 338g
Vitamin C
Vit. C
Vitamin D
Vit. D
Vitamin A
Vit. A
Vitamin E
Vit. E
Vitamin B1
Vit. B1
Vitamin B2
Vit. B2
Vitamin B3
Vit. B3
Vitamin B5
Vit. B5
Vitamin B6
Vit. B6
Vitamin B12
Vit. B12
Vitamin K
Vit. K
Folate
Folate
73%
0%
0%
0%
5%
4.6%
3.8%
8.3%
11%
0%
0.75%
21%
6
100 g
300 g
1 cup, sliced - 135g
Vitamin C
Vit. C
Vitamin D
Vit. D
Vitamin A
Vit. A
Vitamin E
Vit. E
Vitamin B1
Vit. B1
Vitamin B2
Vit. B2
Vitamin B3
Vit. B3
Vitamin B5
Vit. B5
Vitamin B6
Vit. B6
Vitamin B12
Vit. B12
Vitamin K
Vit. K
Folate
Folate
15%
0%
0%
3.8%
14%
40%
7.4%
17%
50%
0%
0.75%
11%
All nutrients comparison - raw data values
Nutrient
DV% diff.
Vitamin C
22mg
4.6mg
19%
Vitamin B6
0.046mg
0.218mg
13%
Vitamin B2
0.02mg
0.173mg
12%
Manganese
0.038mg
0.21mg
7%
Fiber
1.6g
3.1g
6%
Copper
0.115mg
0.07mg
5%
Phosphorus
23mg
56mg
5%
Protein
0.6g
2.73g
4%
Carbs
4.1g
15.36g
4%
Calories
18kcal
68kcal
3%
Vitamin B1
0.02mg
0.056mg
3%
Vitamin B5
0.138mg
0.276mg
3%
Folate
28µg
15µg
3%
Choline
7.3mg
25.9mg
3%
Calcium
27mg
47mg
2%
Potassium
227mg
283mg
2%
Iron
0.4mg
0.55mg
2%
Zinc
0.15mg
0.3mg
1%
Vitamin E
0mg
0.19mg
1%
Vitamin B3
0.2mg
0.392mg
1%
Protein per 100 calories
3.3g
4g
N/A
Calories per 10 g protein
300kcal
249kcal
N/A
Weight per 100 calories
556g
147g
N/A
Fats
0.1g
0.17g
0%
Net carbs
2.5g
12.26g
N/A
Magnesium
16mg
18mg
0%
Sugar
2.5g
2.9g
N/A
Sodium
21mg
16mg
0%
Selenium
0.7µg
0.6µg
0%
Vitamin K
0.3µg
0.3µg
0%
Saturated fat
0.03g
0.041g
0%
Monounsaturated fat
0.017g
0.003g
0%
Polyunsaturated fat
0.045g
0.074g
0%
Tryptophan
0.003mg
0%
Threonine
0.025mg
0%
Isoleucine
0.026mg
0%
Leucine
0.031mg
0%
Lysine
0.03mg
0%
Methionine
0.006mg
0%
Phenylalanine
0.02mg
0%
Valine
0.028mg
0%
Histidine
0.011mg
0%
Macronutrient Comparison
Macronutrient breakdown side-by-side comparison
1
4%
95%
Protein:
0.6 g
Fats:
0.1 g
Carbs:
4.1 g
Water:
94.62 g
Other:
0.58 g
4
3%
15%
81%
Protein:
2.73 g
Fats:
0.17 g
Carbs:
15.36 g
Water:
81 g
Other:
0.74 g
Contains
more
Water Water
+16.8%
Contains
more
Protein Protein
+355%
Contains
more
Fats Fats
+70%
Contains
more
Carbs Carbs
+274.6%
Contains
more
Other Other
+27.6%
Fat Type Comparison
Fat type breakdown side-by-side comparison
2
33%
18%
49%
Saturated fat:
Sat. Fat
0.03 g
Monounsaturated fat:
Mono. Fat
0.017 g
Polyunsaturated fat:
Poly. Fat
0.045 g
1
35%
3%
63%
Saturated fat:
Sat. Fat
0.041 g
Monounsaturated fat:
Mono. Fat
0.003 g
Polyunsaturated fat:
Poly. Fat
0.074 g
Contains
less
Sat. Fat Saturated fat
-26.8%
Contains
more
Mono. Fat Monounsaturated fat
+466.7%
Contains
more
Poly. Fat Polyunsaturated fat
+64.4%