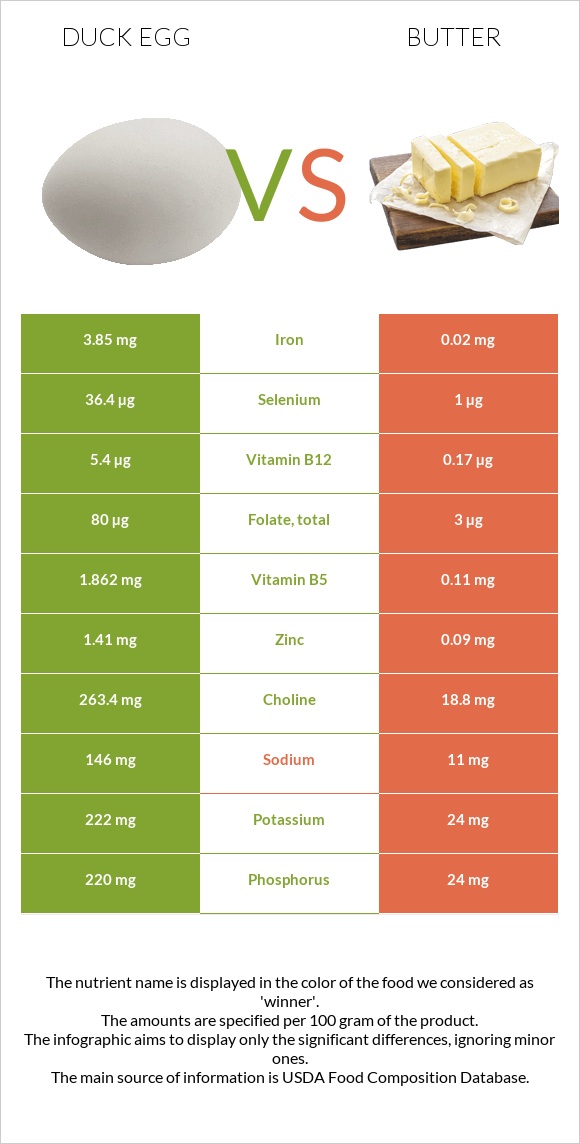
Summary of differences between duck eggs and butter Duck eggs have more vitamin B12, selenium, iron, choline, vitamin B5, vitamin B2, and phosphorus; however, butter is higher in vitamin A. Butter covers your daily need for saturated fat, 234% more than duck eggs. Duck eggs have 193 times more iron than butter. While duck eggs have 3.85mg of iron, butter has only 0.02mg. Butter has less cholesterol. These are the specific foods used in this comparison Egg, duck, whole, fresh, raw and Butter, without salt .
Infographic
Mineral Comparison
Mineral comparison score is based on the number of minerals by which one or the other food is richer. The "coverage" charts below show how much of the daily needs can be covered by 300 grams of the food.
9
100 g
300 g
1 egg - 70g
Magnesium
Magnesium
Calcium
Calcium
Potassium
Potassium
Iron
Iron
Copper
Copper
Zinc
Zinc
Phosphorus
Phosphorus
Sodium
Sodium
Manganese
Manganese
Selenium
Selenium
12%
19%
20%
144%
21%
38%
94%
19%
5%
199%
1
100 g
300 g
1 pat (1" sq, 1/3" high) - 5g 1 tbsp - 14.2g 1 stick - 113g 1 cup - 227g
Magnesium
Magnesium
Calcium
Calcium
Potassium
Potassium
Iron
Iron
Copper
Copper
Zinc
Zinc
Phosphorus
Phosphorus
Sodium
Sodium
Manganese
Manganese
Selenium
Selenium
1.4%
7.2%
2.1%
0.75%
5.3%
2.5%
10%
1.4%
0.52%
5.5%
Vitamin Comparison
Vitamin comparison score is based on the number of vitamins by which one or the other food is richer. The "coverage" charts below show how much of the daily needs can be covered by 300 grams of the food.
8
100 g
300 g
1 egg - 70g
Vitamin C
Vit. C
Vitamin D
Vit. D
Vitamin A
Vit. A
Vitamin E
Vit. E
Vitamin B1
Vit. B1
Vitamin B2
Vit. B2
Vitamin B3
Vit. B3
Vitamin B5
Vit. B5
Vitamin B6
Vit. B6
Vitamin B12
Vit. B12
Vitamin K
Vit. K
Folate
Folate
0%
26%
65%
27%
39%
93%
3.8%
112%
58%
675%
1%
60%
3
100 g
300 g
1 pat (1" sq, 1/3" high) - 5g 1 tbsp - 14.2g 1 stick - 113g 1 cup - 227g
Vitamin C
Vit. C
Vitamin D
Vit. D
Vitamin A
Vit. A
Vitamin E
Vit. E
Vitamin B1
Vit. B1
Vitamin B2
Vit. B2
Vitamin B3
Vit. B3
Vitamin B5
Vit. B5
Vitamin B6
Vit. B6
Vitamin B12
Vit. B12
Vitamin K
Vit. K
Folate
Folate
0%
0%
228%
46%
1.3%
7.8%
0.79%
6.6%
0.69%
21%
18%
2.3%
All nutrients comparison - raw data values
Nutrient
DV% diff.
Cholesterol
884mg
215mg
223%
Vitamin B12
5.4µg
0.17µg
218%
Saturated fat
3.681g
50.489g
213%
Fats
13.77g
81.11g
104%
Selenium
36.4µg
1µg
64%
Vitamin A
194µg
684µg
54%
Iron
3.85mg
0.02mg
48%
Choline
263.4mg
18.8mg
44%
Monounsaturated fat
6.525g
23.43g
42%
Vitamin B5
1.862mg
0.11mg
35%
Phosphorus
220mg
24mg
28%
Vitamin B2
0.404mg
0.034mg
28%
Calories
185kcal
717kcal
27%
Protein
12.81g
0.85g
24%
Vitamin B6
0.25mg
0.003mg
19%
Folate
80µg
3µg
19%
Vitamin B1
0.156mg
0.005mg
13%
Zinc
1.41mg
0.09mg
12%
Polyunsaturated fat
1.223g
3.01g
12%
Vitamin D*
69 IU
0 IU
9%
Vitamin D
1.7µg
0µg
9%
Vitamin E
1.34mg
2.32mg
7%
Potassium
222mg
24mg
6%
Sodium
146mg
11mg
6%
Vitamin K
0.4µg
7µg
6%
Copper
0.062mg
0.016mg
5%
Magnesium
17mg
2mg
4%
Calcium
64mg
24mg
4%
Manganese
0.038mg
0.004mg
1%
Vitamin B3
0.2mg
0.042mg
1%
Protein per 100 calories
6.9g
0.12g
N/A
Calories per 10 g protein
144kcal
8435kcal
N/A
Weight per 100 calories
54g
14g
N/A
Unsaturated / Saturated Fat ratio
2.1
0.52
N/A
Net carbs
1.45g
0.06g
N/A
Carbs
1.45g
0.06g
0%
Sugar
0.93g
0.06g
N/A
Tryptophan
0.26mg
0.012mg
0%
Threonine
0.736mg
0.038mg
0%
Isoleucine
0.598mg
0.051mg
0%
Leucine
1.097mg
0.083mg
0%
Lysine
0.951mg
0.067mg
0%
Methionine
0.576mg
0.021mg
0%
Phenylalanine
0.84mg
0.041mg
0%
Valine
0.885mg
0.057mg
0%
Histidine
0.32mg
0.023mg
0%
Omega-3 - ALA
0.315g
N/A
Omega-6 - Linoleic acid
2.166g
N/A
Macronutrient Comparison
Macronutrient breakdown side-by-side comparison
4
13%
14%
71%
Protein:
12.81 g
Fats:
13.77 g
Carbs:
1.45 g
Water:
70.83 g
Other:
1.14 g
1
81%
18%
Protein:
0.85 g
Fats:
81.11 g
Carbs:
0.06 g
Water:
17.94 g
Other:
0.04 g
Contains
more
Protein Protein
+1407.1%
Contains
more
Carbs Carbs
+2316.7%
Contains
more
Water Water
+294.8%
Contains
more
Other Other
+2750%
Contains
more
Fats Fats
+489%
Fat Type Comparison
Fat type breakdown side-by-side comparison
1
32%
57%
11%
Saturated fat:
Sat. Fat
3.681 g
Monounsaturated fat:
Mono. Fat
6.525 g
Polyunsaturated fat:
Poly. Fat
1.223 g
2
66%
30%
4%
Saturated fat:
Sat. Fat
50.489 g
Monounsaturated fat:
Mono. Fat
23.43 g
Polyunsaturated fat:
Poly. Fat
3.01 g
Contains
less
Sat. Fat Saturated fat
-92.7%
Contains
more
Mono. Fat Monounsaturated fat
+259.1%
Contains
more
Poly. Fat Polyunsaturated fat
+146.1%