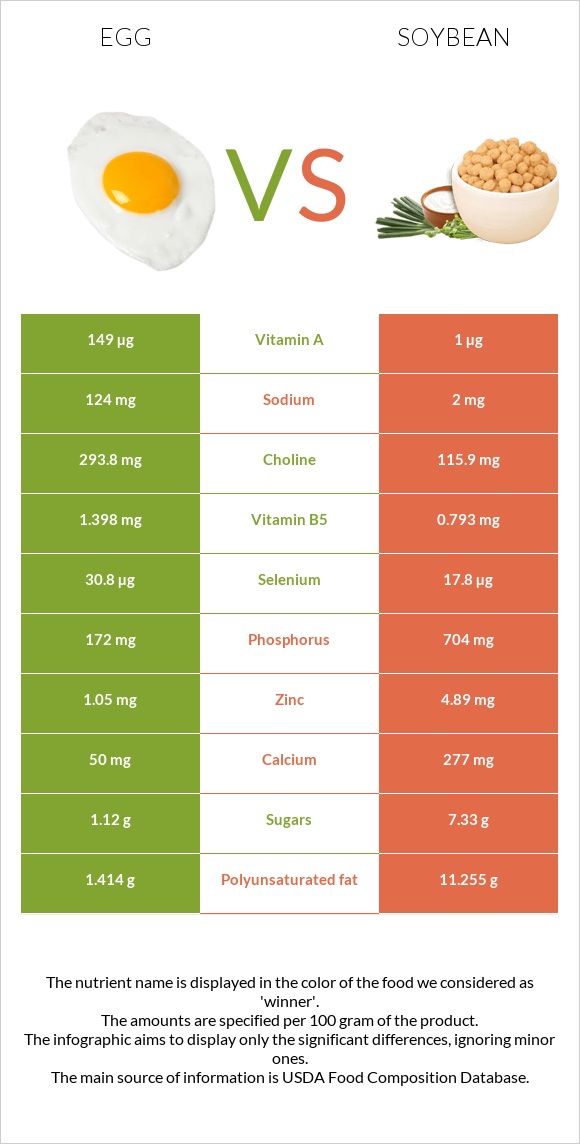
How are eggs and soybeans different? Eggs have more copper, vitamin B12, choline, selenium, and vitamin B5; however, soybeans are richer in iron, manganese, fiber, and magnesium. Eggs cover your daily need for copper, 177% more than soybeans. Soybeans have a higher glycemic index. The glycemic index of soybeans is 14, while the glycemic index of eggs is 0. Egg, whole, cooked, hard-boiled and Soybeans, mature cooked, boiled, without salt types were used in this article.
Infographic
Mineral Comparison
Mineral comparison score is based on the number of minerals by which one or the other food is richer. The "coverage" charts below show how much of the daily needs can be covered by 300 grams of the food.
2
100 g
300 g
1 tbsp - 8.5g 1 large - 50g 1 cup, chopped - 136g
Magnesium
Magnesium
Calcium
Calcium
Potassium
Potassium
Iron
Iron
Copper
Copper
Zinc
Zinc
Phosphorus
Phosphorus
Sodium
Sodium
Manganese
Manganese
Selenium
Selenium
7.1%
15%
11%
45%
667%
29%
74%
16%
3.4%
168%
7
100 g
300 g
1 tbsp - 10.7g 1 cup - 172g
Magnesium
Magnesium
Calcium
Calcium
Potassium
Potassium
Iron
Iron
Copper
Copper
Zinc
Zinc
Phosphorus
Phosphorus
Sodium
Sodium
Manganese
Manganese
Selenium
Selenium
61%
31%
45%
193%
136%
31%
105%
0.13%
107%
40%
Vitamin Comparison
Vitamin comparison score is based on the number of vitamins by which one or the other food is richer. The "coverage" charts below show how much of the daily needs can be covered by 300 grams of the food.
6
100 g
300 g
1 tbsp - 8.5g 1 large - 50g 1 cup, chopped - 136g
Vitamin C
Vit. C
Vitamin D
Vit. D
Vitamin A
Vit. A
Vitamin E
Vit. E
Vitamin B1
Vit. B1
Vitamin B2
Vit. B2
Vitamin B3
Vit. B3
Vitamin B5
Vit. B5
Vitamin B6
Vit. B6
Vitamin B12
Vit. B12
Vitamin K
Vit. K
Folate
Folate
0%
33%
50%
21%
17%
118%
1.2%
84%
28%
139%
0.75%
33%
6
100 g
300 g
1 tbsp - 10.7g 1 cup - 172g
Vitamin C
Vit. C
Vitamin D
Vit. D
Vitamin A
Vit. A
Vitamin E
Vit. E
Vitamin B1
Vit. B1
Vitamin B2
Vit. B2
Vitamin B3
Vit. B3
Vitamin B5
Vit. B5
Vitamin B6
Vit. B6
Vitamin B12
Vit. B12
Vitamin K
Vit. K
Folate
Folate
5.7%
0%
0%
7%
39%
66%
7.5%
11%
54%
0%
48%
41%
All nutrients comparison - raw data values
Nutrient
DV% diff.
Copper
2mg
0.407mg
177%
Cholesterol
373mg
0mg
124%
Iron
1.19mg
5.14mg
49%
Vitamin B12
1.11µg
0µg
46%
Choline
293.8mg
47.5mg
45%
Selenium
30.8µg
7.3µg
43%
Manganese
0.026mg
0.824mg
35%
Fiber
0g
6g
24%
Vitamin B5
1.398mg
0.179mg
24%
Polyunsaturated fat
1.414g
5.064g
24%
Magnesium
10mg
86mg
18%
Vitamin B2
0.513mg
0.285mg
18%
Vitamin A
149µg
0µg
17%
Vitamin K
0.3µg
19.2µg
16%
Protein
12.58g
18.21g
11%
Vitamin D*
87 IU
0 IU
11%
Vitamin D
2.2µg
0µg
11%
Potassium
126mg
515mg
11%
Phosphorus
172mg
245mg
10%
Vitamin B6
0.121mg
0.234mg
9%
Saturated fat
3.267g
1.297g
9%
Vitamin B1
0.066mg
0.155mg
7%
Calcium
50mg
102mg
5%
Sodium
124mg
1mg
5%
Vitamin E
1.03mg
0.35mg
5%
Monounsaturated fat
4.077g
1.981g
5%
Fats
10.61g
8.97g
3%
Folate
44µg
54µg
3%
Vitamin C
0mg
1.7mg
2%
Carbs
1.12g
8.36g
2%
Vitamin B3
0.064mg
0.399mg
2%
Calories
155kcal
172kcal
1%
Zinc
1.05mg
1.15mg
1%
Protein per 100 calories
8.1g
11g
N/A
Calories per 10 g protein
123kcal
94kcal
N/A
Weight per 100 calories
65g
58g
N/A
Unsaturated / Saturated Fat ratio
1.7
5.4
N/A
Net carbs
1.12g
2.36g
N/A
Sugar
1.12g
3g
N/A
Tryptophan
0.153mg
0.242mg
0%
Threonine
0.604mg
0.723mg
0%
Isoleucine
0.686mg
0.807mg
0%
Leucine
1.075mg
1.355mg
0%
Lysine
0.904mg
1.108mg
0%
Methionine
0.392mg
0.224mg
0%
Phenylalanine
0.668mg
0.869mg
0%
Valine
0.767mg
0.831mg
0%
Histidine
0.298mg
0.449mg
0%
Omega-3 - EPA
0.005g
0g
N/A
Omega-3 - DHA
0.038g
0g
N/A
Macronutrient Comparison
Macronutrient breakdown side-by-side comparison
2
13%
11%
75%
Protein:
12.58 g
Fats:
10.61 g
Carbs:
1.12 g
Water:
74.62 g
Other:
1.07 g
3
18%
9%
8%
63%
2%
Protein:
18.21 g
Fats:
8.97 g
Carbs:
8.36 g
Water:
62.55 g
Other:
1.91 g
Contains
more
Fats Fats
+18.3%
Contains
more
Water Water
+19.3%
Contains
more
Protein Protein
+44.8%
Contains
more
Carbs Carbs
+646.4%
Contains
more
Other Other
+78.5%
Fat Type Comparison
Fat type breakdown side-by-side comparison
1
37%
47%
16%
Saturated fat:
Sat. Fat
3.267 g
Monounsaturated fat:
Mono. Fat
4.077 g
Polyunsaturated fat:
Poly. Fat
1.414 g
2
16%
24%
61%
Saturated fat:
Sat. Fat
1.297 g
Monounsaturated fat:
Mono. Fat
1.981 g
Polyunsaturated fat:
Poly. Fat
5.064 g
Contains
more
Mono. Fat Monounsaturated fat
+105.8%
Contains
less
Sat. Fat Saturated fat
-60.3%
Contains
more
Poly. Fat Polyunsaturated fat
+258.1%