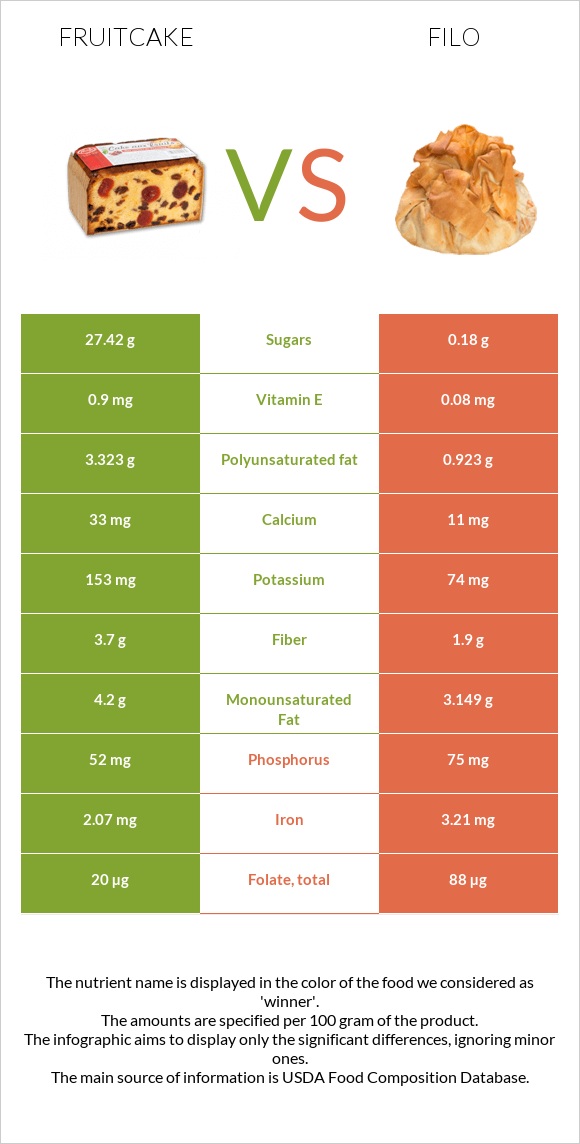
How are fruitcake and filo different? Fruitcake is richer in fiber, while filo is higher in vitamin B1, selenium, vitamin B3, vitamin B2, folate, iron, manganese, and copper. Filo covers your daily need for vitamin B1, 41% more than fruitcake. Fruitcake contains 2 times more fiber than filo. Fruitcake contains 3.7g of fiber, while filo contains 1.9g. Fruitcake is lower in sodium. Fruitcake has a higher glycemic index (53) than filo (38). Cake, fruitcake, commercially prepared and Phyllo dough types were used in this article.
Infographic
Mineral Comparison
Mineral comparison score is based on the number of minerals by which one or the other food is richer. The "coverage" charts below show how much of the daily needs can be covered by 300 grams of the food.
3
100 g
300 g
1 oz - 28.35g 1 piece - 43g
Magnesium
Magnesium
Calcium
Calcium
Potassium
Potassium
Iron
Iron
Copper
Copper
Zinc
Zinc
Phosphorus
Phosphorus
Sodium
Sodium
Manganese
Manganese
Selenium
Selenium
11%
9.9%
14%
78%
17%
7.4%
22%
13%
29%
11%
6
100 g
300 g
1 sheet dough - 19g 1 oz - 28.35g
Magnesium
Magnesium
Calcium
Calcium
Potassium
Potassium
Iron
Iron
Copper
Copper
Zinc
Zinc
Phosphorus
Phosphorus
Sodium
Sodium
Manganese
Manganese
Selenium
Selenium
11%
3.3%
6.5%
120%
34%
13%
32%
63%
62%
127%
Vitamin Comparison
Vitamin comparison score is based on the number of vitamins by which one or the other food is richer. The "coverage" charts below show how much of the daily needs can be covered by 300 grams of the food.
5
100 g
300 g
1 oz - 28.35g 1 piece - 43g
Vitamin C
Vit. C
Vitamin D
Vit. D
Vitamin A
Vit. A
Vitamin E
Vit. E
Vitamin B1
Vit. B1
Vitamin B2
Vit. B2
Vitamin B3
Vit. B3
Vitamin B5
Vit. B5
Vitamin B6
Vit. B6
Vitamin B12
Vit. B12
Vitamin K
Vit. K
Folate
Folate
1.7%
0%
2.3%
18%
13%
23%
15%
14%
11%
1.3%
3.8%
15%
6
100 g
300 g
1 sheet dough - 19g 1 oz - 28.35g
Vitamin C
Vit. C
Vitamin D
Vit. D
Vitamin A
Vit. A
Vitamin E
Vit. E
Vitamin B1
Vit. B1
Vitamin B2
Vit. B2
Vitamin B3
Vit. B3
Vitamin B5
Vit. B5
Vitamin B6
Vit. B6
Vitamin B12
Vit. B12
Vitamin K
Vit. K
Folate
Folate
0%
0%
0%
1.6%
135%
79%
76%
18%
6.9%
0%
6.3%
66%
All nutrients comparison - raw data values
Nutrient
DV% diff.
Vitamin B1
0.05mg
0.541mg
41%
Selenium
2µg
23.3µg
39%
Vitamin B3
0.791mg
4.073mg
21%
Vitamin B2
0.099mg
0.341mg
19%
Sodium
101mg
483mg
17%
Folate
20µg
88µg
17%
Polyunsaturated fat
3.323g
0.923g
16%
Iron
2.07mg
3.21mg
14%
Manganese
0.22mg
0.476mg
11%
Protein
2.9g
7.1g
8%
Fiber
3.7g
1.9g
7%
Copper
0.05mg
0.101mg
6%
Fats
9.1g
6g
5%
Vitamin E
0.9mg
0.08mg
5%
Carbs
61.6g
52.6g
3%
Phosphorus
52mg
75mg
3%
Monounsaturated fat
4.2g
3.149g
3%
Cholesterol
5mg
0mg
2%
Calcium
33mg
11mg
2%
Potassium
153mg
74mg
2%
Zinc
0.27mg
0.49mg
2%
Vitamin B5
0.226mg
0.302mg
2%
Saturated fat
1.048g
1.47g
2%
Calories
324kcal
299kcal
1%
Vitamin C
0.5mg
0mg
1%
Vitamin A
7µg
0µg
1%
Vitamin B6
0.046mg
0.03mg
1%
Vitamin K
1.5µg
2.5µg
1%
Protein per 100 calories
0.9g
2.4g
N/A
Calories per 10 g protein
1117kcal
421kcal
N/A
Weight per 100 calories
31g
33g
N/A
Unsaturated / Saturated Fat ratio
7.2
2.8
N/A
Net carbs
57.9g
50.7g
N/A
Magnesium
16mg
15mg
0%
Sugar
27.42g
0.18g
N/A
Vitamin B12
0.01µg
0µg
0%
Choline
8.9mg
6.9mg
0%
Tryptophan
0.042mg
0.088mg
0%
Threonine
0.102mg
0.194mg
0%
Isoleucine
0.121mg
0.246mg
0%
Leucine
0.206mg
0.49mg
0%
Lysine
0.121mg
0.158mg
0%
Methionine
0.059mg
0.126mg
0%
Phenylalanine
0.14mg
0.359mg
0%
Valine
0.144mg
0.286mg
0%
Histidine
0.071mg
0.159mg
0%
Omega-3 - DHA
0.001g
0g
N/A
Macronutrient Comparison
Macronutrient breakdown side-by-side comparison
2
3%
9%
62%
25%
Protein:
2.9 g
Fats:
9.1 g
Carbs:
61.6 g
Water:
25.3 g
Other:
1.1 g
3
7%
6%
53%
33%
2%
Protein:
7.1 g
Fats:
6 g
Carbs:
52.6 g
Water:
32.6 g
Other:
1.7 g
Contains
more
Fats Fats
+51.7%
Contains
more
Carbs Carbs
+17.1%
Contains
more
Protein Protein
+144.8%
Contains
more
Water Water
+28.9%
Contains
more
Other Other
+54.5%
Fat Type Comparison
Fat type breakdown side-by-side comparison
3
12%
49%
39%
Saturated fat:
Sat. Fat
1.048 g
Monounsaturated fat:
Mono. Fat
4.2 g
Polyunsaturated fat:
Poly. Fat
3.323 g
0
27%
57%
17%
Saturated fat:
Sat. Fat
1.47 g
Monounsaturated fat:
Mono. Fat
3.149 g
Polyunsaturated fat:
Poly. Fat
0.923 g
Contains
less
Sat. Fat Saturated fat
-28.7%
Contains
more
Mono. Fat Monounsaturated fat
+33.4%
Contains
more
Poly. Fat Polyunsaturated fat
+260%