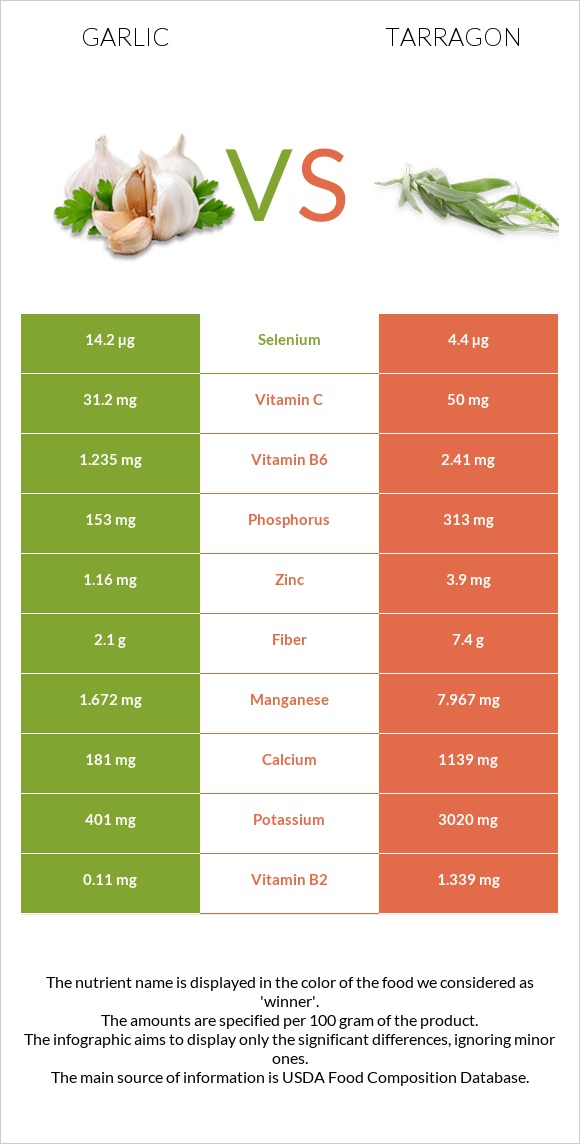
What are the main differences between garlic and tarragon? Garlic has less iron, manganese, calcium, vitamin B2, vitamin B6, vitamin A, potassium, magnesium, folate, and vitamin B3 than tarragon. Tarragon's daily need coverage for iron is 383% higher. Tarragon has a lower glycemic index than garlic. We used Garlic, raw and Spices, tarragon, dried types in this comparison.
Infographic
Mineral Comparison
Mineral comparison score is based on the number of minerals by which one or the other food is richer. The "coverage" charts below show how much of the daily needs can be covered by 300 grams of the food.
2
100 g
300 g
1 tsp - 2.8g 1 clove - 3g 3 cloves - 9g 1 cup - 136g
Magnesium
Magnesium
Calcium
Calcium
Potassium
Potassium
Iron
Iron
Copper
Copper
Zinc
Zinc
Phosphorus
Phosphorus
Sodium
Sodium
Manganese
Manganese
Selenium
Selenium
18%
54%
35%
64%
100%
32%
66%
2.2%
218%
77%
8
100 g
300 g
0.25 tsp - 0.5g 1 tsp, ground - 1.6g 1 tbsp, leaves - 1.8g 1 tbsp, ground - 4.8g
Magnesium
Magnesium
Calcium
Calcium
Potassium
Potassium
Iron
Iron
Copper
Copper
Zinc
Zinc
Phosphorus
Phosphorus
Sodium
Sodium
Manganese
Manganese
Selenium
Selenium
248%
342%
266%
1211%
226%
106%
134%
8.1%
1039%
24%
Vitamin Comparison
Vitamin comparison score is based on the number of vitamins by which one or the other food is richer. The "coverage" charts below show how much of the daily needs can be covered by 300 grams of the food.
3
100 g
300 g
1 tsp - 2.8g 1 clove - 3g 3 cloves - 9g 1 cup - 136g
Vitamin C
Vit. C
Vitamin D
Vit. D
Vitamin A
Vit. A
Vitamin E
Vit. E
Vitamin B1
Vit. B1
Vitamin B2
Vit. B2
Vitamin B3
Vit. B3
Vitamin B5
Vit. B5
Vitamin B6
Vit. B6
Vitamin B12
Vit. B12
Vitamin K
Vit. K
Folate
Folate
104%
0%
0%
1.6%
50%
25%
13%
36%
285%
0%
4.3%
2.3%
7
100 g
300 g
0.25 tsp - 0.5g 1 tsp, ground - 1.6g 1 tbsp, leaves - 1.8g 1 tbsp, ground - 4.8g
Vitamin C
Vit. C
Vitamin D
Vit. D
Vitamin A
Vit. A
Vitamin E
Vit. E
Vitamin B1
Vit. B1
Vitamin B2
Vit. B2
Vitamin B3
Vit. B3
Vitamin B5
Vit. B5
Vitamin B6
Vit. B6
Vitamin B12
Vit. B12
Vitamin K
Vit. K
Folate
Folate
167%
0%
70%
0%
63%
309%
168%
0%
556%
0%
0%
206%
All nutrients comparison - raw data values
Nutrient
DV% diff.
Iron
1.7mg
32.3mg
383%
Manganese
1.672mg
7.967mg
274%
Calcium
181mg
1139mg
96%
Vitamin B2
0.11mg
1.339mg
95%
Vitamin B6
1.235mg
2.41mg
90%
Magnesium
25mg
347mg
77%
Potassium
401mg
3020mg
77%
Folate
3µg
274µg
68%
Vitamin B3
0.7mg
8.95mg
52%
Copper
0.299mg
0.677mg
42%
Protein
6.36g
22.77g
33%
Zinc
1.16mg
3.9mg
25%
Phosphorus
153mg
313mg
23%
Vitamin A
0µg
210µg
23%
Polyunsaturated fat
0.249g
3.698g
23%
Vitamin C
31.2mg
50mg
21%
Fiber
2.1g
7.4g
21%
Selenium
14.2µg
4.4µg
18%
Vitamin B5
0.596mg
12%
Fats
0.5g
7.24g
10%
Saturated fat
0.089g
1.881g
8%
Calories
149kcal
295kcal
7%
Carbs
33.06g
50.22g
6%
Vitamin B1
0.2mg
0.251mg
4%
Choline
23.2mg
4%
Sodium
17mg
62mg
2%
Vitamin E
0.08mg
1%
Vitamin K
1.7µg
1%
Monounsaturated fat
0.011g
0.474g
1%
Protein per 100 calories
4.3g
7.7g
N/A
Calories per 10 g protein
234kcal
130kcal
N/A
Weight per 100 calories
67g
34g
N/A
Unsaturated / Saturated Fat ratio
2.9
2.2
N/A
Net carbs
30.96g
42.82g
N/A
Sugar
1g
N/A
Tryptophan
0.066mg
0%
Threonine
0.157mg
0%
Isoleucine
0.217mg
0%
Leucine
0.308mg
0%
Lysine
0.273mg
0%
Methionine
0.076mg
0%
Phenylalanine
0.183mg
0%
Valine
0.291mg
0%
Histidine
0.113mg
0%
Macronutrient Comparison
Macronutrient breakdown side-by-side comparison
1
6%
33%
59%
Protein:
6.36 g
Fats:
0.5 g
Carbs:
33.06 g
Water:
58.58 g
Other:
1.5 g
4
23%
7%
50%
8%
12%
Protein:
22.77 g
Fats:
7.24 g
Carbs:
50.22 g
Water:
7.74 g
Other:
12.03 g
Contains
more
Water Water
+656.8%
Contains
more
Protein Protein
+258%
Contains
more
Fats Fats
+1348%
Contains
more
Carbs Carbs
+51.9%
Contains
more
Other Other
+702%
Fat Type Comparison
Fat type breakdown side-by-side comparison
1
26%
3%
71%
Saturated fat:
Sat. Fat
0.089 g
Monounsaturated fat:
Mono. Fat
0.011 g
Polyunsaturated fat:
Poly. Fat
0.249 g
2
31%
8%
61%
Saturated fat:
Sat. Fat
1.881 g
Monounsaturated fat:
Mono. Fat
0.474 g
Polyunsaturated fat:
Poly. Fat
3.698 g
Contains
less
Sat. Fat Saturated fat
-95.3%
Contains
more
Mono. Fat Monounsaturated fat
+4209.1%
Contains
more
Poly. Fat Polyunsaturated fat
+1385.1%