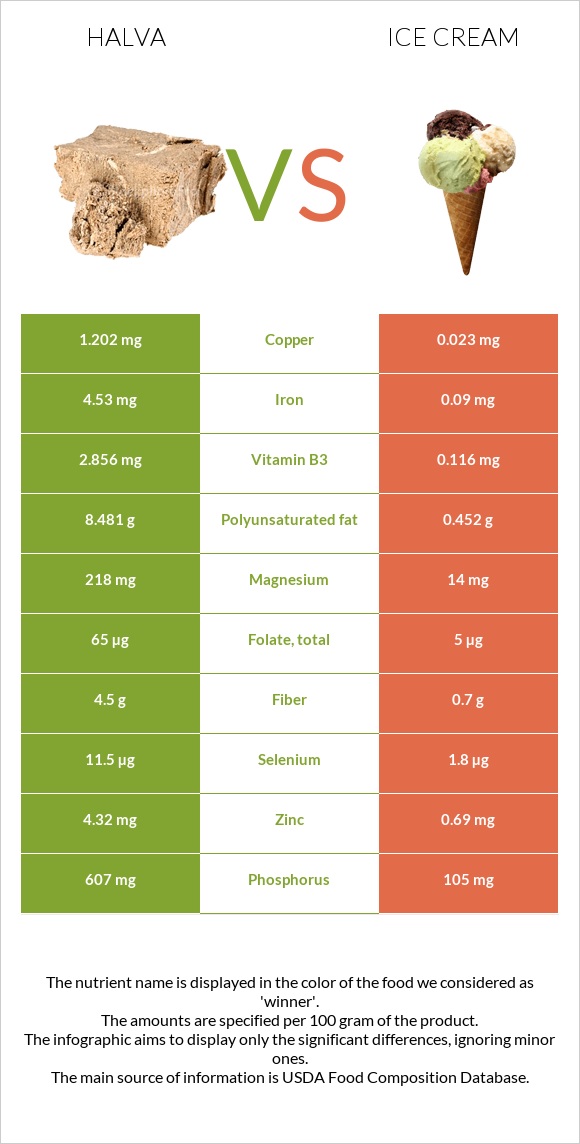
Important differences between halva and ice cream Ice cream has less copper, phosphorus, iron, magnesium, manganese, zinc, vitamin B1, vitamin B6, selenium, and vitamin B3. Halva's daily need coverage for copper is 131% more. Halva has 109 times more manganese than ice cream. Halva has 0.873mg of manganese, while ice cream has 0.008mg. The food varieties used in the comparison are Candies, halavah, plain and Ice creams, vanilla .
Infographic
Mineral Comparison
Mineral comparison score is based on the number of minerals by which one or the other food is richer. The "coverage" charts below show how much of the daily needs can be covered by 300 grams of the food.
7
100 g
300 g
1 oz - 28.35g
Magnesium
Magnesium
Calcium
Calcium
Potassium
Potassium
Iron
Iron
Copper
Copper
Zinc
Zinc
Phosphorus
Phosphorus
Sodium
Sodium
Manganese
Manganese
Selenium
Selenium
156%
9.9%
17%
170%
401%
118%
260%
25%
114%
63%
2
100 g
300 g
1 serving 1/2 cup - 66g
Magnesium
Magnesium
Calcium
Calcium
Potassium
Potassium
Iron
Iron
Copper
Copper
Zinc
Zinc
Phosphorus
Phosphorus
Sodium
Sodium
Manganese
Manganese
Selenium
Selenium
10%
38%
18%
3.4%
7.7%
19%
45%
10%
1%
9.8%
Vitamin Comparison
Vitamin comparison score is based on the number of vitamins by which one or the other food is richer. The "coverage" charts below show how much of the daily needs can be covered by 300 grams of the food.
4
100 g
300 g
1 oz - 28.35g
Vitamin C
Vit. C
Vitamin D
Vit. D
Vitamin A
Vit. A
Vitamin E
Vit. E
Vitamin B1
Vit. B1
Vitamin B2
Vit. B2
Vitamin B3
Vit. B3
Vitamin B5
Vit. B5
Vitamin B6
Vit. B6
Vitamin B12
Vit. B12
Vitamin K
Vit. K
Folate
Folate
0.33%
0%
0%
0%
106%
20%
54%
10%
80%
5%
0%
49%
8
100 g
300 g
1 serving 1/2 cup - 66g
Vitamin C
Vit. C
Vitamin D
Vit. D
Vitamin A
Vit. A
Vitamin E
Vit. E
Vitamin B1
Vit. B1
Vitamin B2
Vit. B2
Vitamin B3
Vit. B3
Vitamin B5
Vit. B5
Vitamin B6
Vit. B6
Vitamin B12
Vit. B12
Vitamin K
Vit. K
Folate
Folate
2%
3%
39%
6%
10%
55%
2.2%
35%
11%
49%
0.75%
3.8%
All nutrients comparison - raw data values
Nutrient
DV% diff.
Copper
1.202mg
0.023mg
131%
Phosphorus
607mg
105mg
72%
Iron
4.53mg
0.09mg
56%
Polyunsaturated fat
8.481g
0.452g
54%
Magnesium
218mg
14mg
49%
Manganese
0.873mg
0.008mg
38%
Zinc
4.32mg
0.69mg
33%
Vitamin B1
0.424mg
0.041mg
32%
Vitamin B6
0.348mg
0.048mg
23%
Protein
12.49g
3.5g
18%
Selenium
11.5µg
1.8µg
18%
Vitamin B3
2.856mg
0.116mg
17%
Fats
21.52g
11g
16%
Cholesterol
0mg
44mg
15%
Fiber
4.5g
0.7g
15%
Vitamin B12
0.04µg
0.39µg
15%
Folate
65µg
5µg
15%
Calories
469kcal
207kcal
13%
Vitamin A
0µg
118µg
13%
Monounsaturated fat
8.194g
2.969g
13%
Carbs
60.49g
23.6g
12%
Vitamin B2
0.088mg
0.24mg
12%
Saturated fat
4.127g
6.79g
12%
Calcium
33mg
128mg
10%
Vitamin B5
0.174mg
0.581mg
8%
Sodium
195mg
80mg
5%
Choline
26mg
5%
Vitamin E
0.3mg
2%
Vitamin C
0.1mg
0.6mg
1%
Vitamin D*
8 IU
1%
Vitamin D
0.2µg
1%
Protein per 100 calories
2.7g
1.7g
N/A
Calories per 10 g protein
376kcal
591kcal
N/A
Weight per 100 calories
21g
48g
N/A
Unsaturated / Saturated Fat ratio
4
0.5
N/A
Net carbs
55.99g
22.9g
N/A
Potassium
187mg
199mg
0%
Sugar
21.22g
N/A
Vitamin K
0.3µg
0%
Tryptophan
0.045mg
0%
Threonine
0.146mg
0%
Isoleucine
0.195mg
0%
Leucine
0.316mg
0%
Lysine
0.258mg
0%
Methionine
0.081mg
0%
Phenylalanine
0.157mg
0%
Valine
0.217mg
0%
Histidine
0.088mg
0%
Omega-3 - EPA
0g
0.003g
N/A
Macronutrient Comparison
Macronutrient breakdown side-by-side comparison
4
12%
22%
60%
4%
2%
Protein:
12.49 g
Fats:
21.52 g
Carbs:
60.49 g
Water:
3.67 g
Other:
1.83 g
1
4%
11%
24%
61%
Protein:
3.5 g
Fats:
11 g
Carbs:
23.6 g
Water:
61 g
Other:
0.9 g
Contains
more
Protein Protein
+256.9%
Contains
more
Fats Fats
+95.6%
Contains
more
Carbs Carbs
+156.3%
Contains
more
Other Other
+103.3%
Contains
more
Water Water
+1562.1%
Fat Type Comparison
Fat type breakdown side-by-side comparison
3
20%
39%
41%
Saturated fat:
Sat. Fat
4.127 g
Monounsaturated fat:
Mono. Fat
8.194 g
Polyunsaturated fat:
Poly. Fat
8.481 g
0
66%
29%
4%
Saturated fat:
Sat. Fat
6.79 g
Monounsaturated fat:
Mono. Fat
2.969 g
Polyunsaturated fat:
Poly. Fat
0.452 g
Contains
less
Sat. Fat Saturated fat
-39.2%
Contains
more
Mono. Fat Monounsaturated fat
+176%
Contains
more
Poly. Fat Polyunsaturated fat
+1776.3%