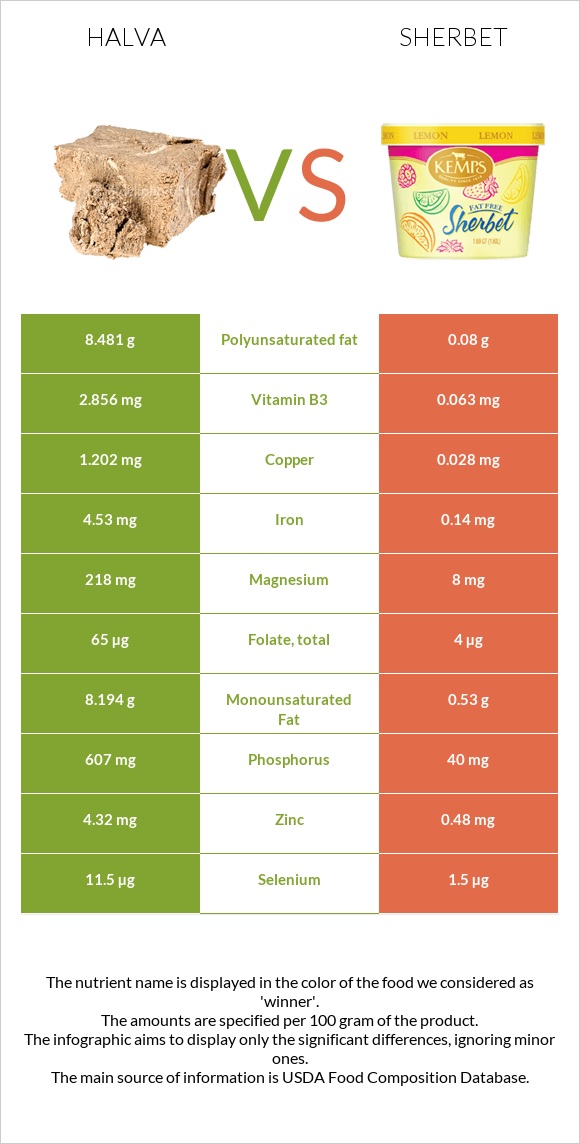
The main differences between halva and sherbet Halva is richer than sherbet in copper, phosphorus, iron, magnesium, manganese, zinc, vitamin B1, vitamin B6, selenium, and vitamin B3. Daily need coverage for copper for halva is 130% higher. Halva contains 79 times more manganese than sherbet. Halva contains 0.873mg of manganese, while sherbet contains 0.011mg. Food types used in this article are Candies, halavah, plain and Sherbet, orange .
Infographic
Mineral Comparison
Mineral comparison score is based on the number of minerals by which one or the other food is richer. The "coverage" charts below show how much of the daily needs can be covered by 300 grams of the food.
8
100 g
300 g
1 oz - 28.35g
Magnesium
Magnesium
Calcium
Calcium
Potassium
Potassium
Iron
Iron
Copper
Copper
Zinc
Zinc
Phosphorus
Phosphorus
Sodium
Sodium
Manganese
Manganese
Selenium
Selenium
156%
9.9%
17%
170%
401%
118%
260%
25%
114%
63%
2
100 g
300 g
1 bar (2.75 fl oz) - 66g 0.5 cup (4 fl oz) - 74g
Magnesium
Magnesium
Calcium
Calcium
Potassium
Potassium
Iron
Iron
Copper
Copper
Zinc
Zinc
Phosphorus
Phosphorus
Sodium
Sodium
Manganese
Manganese
Selenium
Selenium
5.7%
16%
8.5%
5.3%
9.3%
13%
17%
6%
1.4%
8.2%
Vitamin Comparison
Vitamin comparison score is based on the number of vitamins by which one or the other food is richer. The "coverage" charts below show how much of the daily needs can be covered by 300 grams of the food.
4
100 g
300 g
1 oz - 28.35g
Vitamin C
Vit. C
Vitamin D
Vit. D
Vitamin A
Vit. A
Vitamin E
Vit. E
Vitamin B1
Vit. B1
Vitamin B2
Vit. B2
Vitamin B3
Vit. B3
Vitamin B5
Vit. B5
Vitamin B6
Vit. B6
Vitamin B12
Vit. B12
Vitamin K
Vit. K
Folate
Folate
0.33%
0%
0%
0%
106%
20%
54%
10%
80%
5%
0%
49%
6
100 g
300 g
1 bar (2.75 fl oz) - 66g 0.5 cup (4 fl oz) - 74g
Vitamin C
Vit. C
Vitamin D
Vit. D
Vitamin A
Vit. A
Vitamin E
Vit. E
Vitamin B1
Vit. B1
Vitamin B2
Vit. B2
Vitamin B3
Vit. B3
Vitamin B5
Vit. B5
Vitamin B6
Vit. B6
Vitamin B12
Vit. B12
Vitamin K
Vit. K
Folate
Folate
7.7%
0%
4%
0.2%
6.8%
22%
1.2%
13%
5.3%
16%
0%
3%
All nutrients comparison - raw data values
Nutrient
DV% diff.
Copper
1.202mg
0.028mg
130%
Phosphorus
607mg
40mg
81%
Polyunsaturated fat
8.481g
0.08g
56%
Iron
4.53mg
0.14mg
55%
Magnesium
218mg
8mg
50%
Manganese
0.873mg
0.011mg
37%
Zinc
4.32mg
0.48mg
35%
Vitamin B1
0.424mg
0.027mg
33%
Fats
21.52g
2g
30%
Vitamin B6
0.348mg
0.023mg
25%
Protein
12.49g
1.1g
23%
Monounsaturated fat
8.194g
0.53g
19%
Selenium
11.5µg
1.5µg
18%
Vitamin B3
2.856mg
0.063mg
17%
Calories
469kcal
144kcal
16%
Folate
65µg
4µg
15%
Fiber
4.5g
1.3g
13%
Saturated fat
4.127g
1.16g
13%
Carbs
60.49g
30.4g
10%
Sodium
195mg
46mg
6%
Vitamin B12
0.04µg
0.13µg
4%
Potassium
187mg
96mg
3%
Vitamin C
0.1mg
2.3mg
2%
Calcium
33mg
54mg
2%
Vitamin A
0µg
12µg
1%
Vitamin B2
0.088mg
0.097mg
1%
Vitamin B5
0.174mg
0.224mg
1%
Choline
7.7mg
1%
Protein per 100 calories
2.7g
0.76g
N/A
Calories per 10 g protein
376kcal
1309kcal
N/A
Weight per 100 calories
21g
69g
N/A
Unsaturated / Saturated Fat ratio
4
0.53
N/A
Net carbs
55.99g
29.1g
N/A
Cholesterol
0mg
1mg
0%
Sugar
24.32g
N/A
Vitamin E
0.01mg
0%
Macronutrient Comparison
Macronutrient breakdown side-by-side comparison
4
12%
22%
60%
4%
2%
Protein:
12.49 g
Fats:
21.52 g
Carbs:
60.49 g
Water:
3.67 g
Other:
1.83 g
1
2%
30%
66%
Protein:
1.1 g
Fats:
2 g
Carbs:
30.4 g
Water:
66.1 g
Other:
0.4 g
Contains
more
Protein Protein
+1035.5%
Contains
more
Fats Fats
+976%
Contains
more
Carbs Carbs
+99%
Contains
more
Other Other
+357.5%
Contains
more
Water Water
+1701.1%
Fat Type Comparison
Fat type breakdown side-by-side comparison
2
20%
39%
41%
Saturated fat:
Sat. Fat
4.127 g
Monounsaturated fat:
Mono. Fat
8.194 g
Polyunsaturated fat:
Poly. Fat
8.481 g
1
66%
30%
5%
Saturated fat:
Sat. Fat
1.16 g
Monounsaturated fat:
Mono. Fat
0.53 g
Polyunsaturated fat:
Poly. Fat
0.08 g
Contains
more
Mono. Fat Monounsaturated fat
+1446%
Contains
more
Poly. Fat Polyunsaturated fat
+10501.3%
Contains
less
Sat. Fat Saturated fat
-71.9%