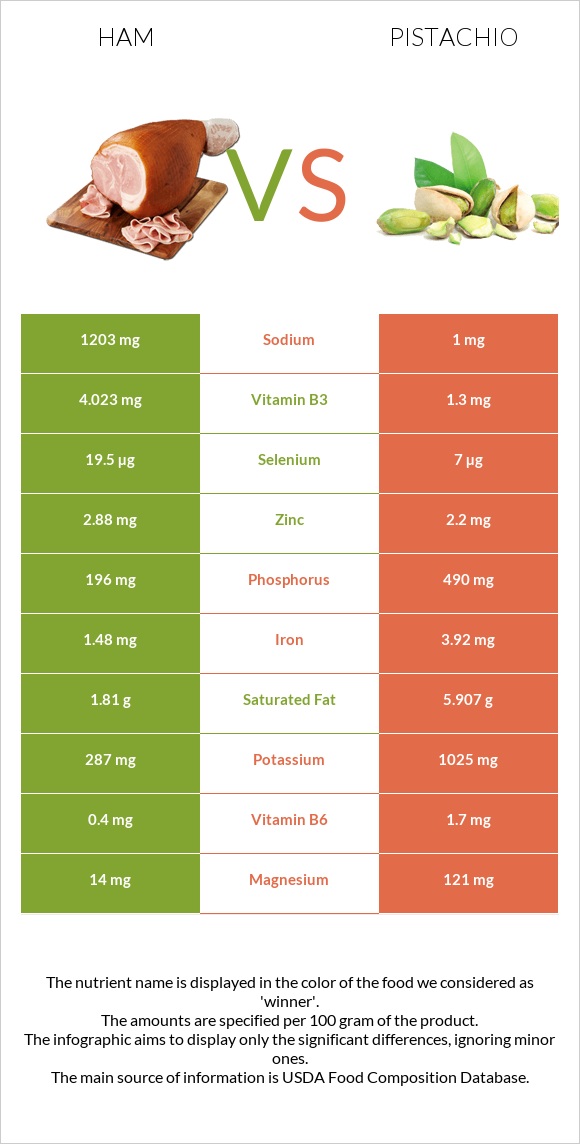
A recap on the differences between ham and pistachios Ham has more vitamin B12 and selenium; however, pistachios are higher in copper, vitamin B6, manganese, fiber, phosphorus, iron, and magnesium. Pistachios cover your daily copper needs 136% more than ham. Pistachios have less sodium. The glycemic index of pistachios is higher. Food varieties used in this article are Pork, cured, ham, boneless, extra lean (approximately 5% fat), roasted and Nuts, pistachio nuts, raw .
Infographic
Mineral Comparison
Mineral comparison score is based on the number of minerals by which one or the other food is richer. The "coverage" charts below show how much of the daily needs can be covered by 300 grams of the food.
2
100 g
300 g
3 oz - 85g 1 cup - 140g
Magnesium
Magnesium
Calcium
Calcium
Potassium
Potassium
Iron
Iron
Copper
Copper
Zinc
Zinc
Phosphorus
Phosphorus
Sodium
Sodium
Manganese
Manganese
Selenium
Selenium
10%
2.4%
25%
56%
26%
79%
84%
157%
7%
106%
8
100 g
300 g
1 kernel - 0.7g 1 oz (49 kernels) - 28.35g 1 cup - 123g
Magnesium
Magnesium
Calcium
Calcium
Potassium
Potassium
Iron
Iron
Copper
Copper
Zinc
Zinc
Phosphorus
Phosphorus
Sodium
Sodium
Manganese
Manganese
Selenium
Selenium
86%
32%
90%
147%
433%
60%
210%
0.13%
157%
38%
Vitamin Comparison
Vitamin comparison score is based on the number of vitamins by which one or the other food is richer. The "coverage" charts below show how much of the daily needs can be covered by 300 grams of the food.
4
100 g
300 g
3 oz - 85g 1 cup - 140g
Vitamin C
Vit. C
Vitamin D
Vit. D
Vitamin A
Vit. A
Vitamin E
Vit. E
Vitamin B1
Vit. B1
Vitamin B2
Vit. B2
Vitamin B3
Vit. B3
Vitamin B5
Vit. B5
Vitamin B6
Vit. B6
Vitamin B12
Vit. B12
Vitamin K
Vit. K
Folate
Folate
0%
12%
0%
5%
189%
47%
75%
24%
92%
81%
0%
2.3%
7
100 g
300 g
1 kernel - 0.7g 1 oz (49 kernels) - 28.35g 1 cup - 123g
Vitamin C
Vit. C
Vitamin D
Vit. D
Vitamin A
Vit. A
Vitamin E
Vit. E
Vitamin B1
Vit. B1
Vitamin B2
Vit. B2
Vitamin B3
Vit. B3
Vitamin B5
Vit. B5
Vitamin B6
Vit. B6
Vitamin B12
Vit. B12
Vitamin K
Vit. K
Folate
Folate
19%
0%
8.7%
57%
218%
37%
24%
31%
392%
0%
0%
38%
All nutrients comparison - raw data values
Nutrient
DV% diff.
Copper
0.079mg
1.3mg
136%
Vitamin B6
0.4mg
1.7mg
100%
Polyunsaturated fat
0.54g
14.38g
92%
Fats
5.53g
45.32g
61%
Sodium
1203mg
1mg
52%
Monounsaturated fat
2.62g
23.257g
52%
Manganese
0.054mg
1.2mg
50%
Fiber
0g
10.6g
42%
Phosphorus
196mg
490mg
42%
Iron
1.48mg
3.92mg
31%
Vitamin B12
0.65µg
0µg
27%
Magnesium
14mg
121mg
25%
Selenium
19.5µg
7µg
23%
Potassium
287mg
1025mg
22%
Calories
145kcal
560kcal
21%
Saturated fat
1.81g
5.907g
19%
Cholesterol
53mg
0mg
18%
Vitamin E
0.25mg
2.86mg
17%
Vitamin B3
4.023mg
1.3mg
17%
Choline
85.1mg
15%
Folate
3µg
51µg
12%
Calcium
8mg
105mg
10%
Vitamin B1
0.754mg
0.87mg
10%
Carbs
1.5g
27.17g
9%
Vitamin C
0mg
5.6mg
6%
Zinc
2.88mg
2.2mg
6%
Vitamin D*
32 IU
0 IU
4%
Vitamin D
0.8µg
0µg
4%
Vitamin A
0µg
26µg
3%
Vitamin B2
0.202mg
0.16mg
3%
Protein
20.93g
20.16g
2%
Vitamin B5
0.403mg
0.52mg
2%
Starch
1.67g
1%
Protein per 100 calories
14g
3.6g
N/A
Calories per 10 g protein
69kcal
278kcal
N/A
Weight per 100 calories
69g
18g
N/A
Unsaturated / Saturated Fat ratio
1.7
6.4
N/A
Net carbs
1.5g
16.57g
N/A
Sugar
0g
7.66g
N/A
Tryptophan
0.251mg
0.251mg
0%
Threonine
0.931mg
0.684mg
0%
Isoleucine
0.918mg
0.917mg
0%
Leucine
1.661mg
1.604mg
0%
Lysine
1.775mg
1.138mg
0%
Methionine
0.553mg
0.36mg
0%
Phenylalanine
0.904mg
1.092mg
0%
Valine
0.908mg
1.249mg
0%
Histidine
0.75mg
0.512mg
0%
Fructose
0.24g
0%
Omega-6 - Linoleic acid
14.091g
N/A
Macronutrient Comparison
Macronutrient breakdown side-by-side comparison
3
21%
6%
68%
4%
Protein:
20.93 g
Fats:
5.53 g
Carbs:
1.5 g
Water:
67.67 g
Other:
4.37 g
2
20%
45%
27%
4%
3%
Protein:
20.16 g
Fats:
45.32 g
Carbs:
27.17 g
Water:
4.37 g
Other:
2.98 g
Contains
more
Water Water
+1448.5%
Contains
more
Other Other
+46.6%
Contains
more
Fats Fats
+719.5%
Contains
more
Carbs Carbs
+1711.3%
~equal in
Protein
~20.16g
Fat Type Comparison
Fat type breakdown side-by-side comparison
1
36%
53%
11%
Saturated fat:
Sat. Fat
1.81 g
Monounsaturated fat:
Mono. Fat
2.62 g
Polyunsaturated fat:
Poly. Fat
0.54 g
2
14%
53%
33%
Saturated fat:
Sat. Fat
5.907 g
Monounsaturated fat:
Mono. Fat
23.257 g
Polyunsaturated fat:
Poly. Fat
14.38 g
Contains
less
Sat. Fat Saturated fat
-69.4%
Contains
more
Mono. Fat Monounsaturated fat
+787.7%
Contains
more
Poly. Fat Polyunsaturated fat
+2563%