Differences between jerky and granola Jerky contains less vitamin B12, vitamin B6, folate, vitamin B2, vitamin B3, vitamin B1, copper, and vitamin A than granola. Granola's daily need coverage for vitamin B12 is 459% higher. Granola contains 8 times less sodium than jerky. Jerky contains 2081mg of sodium, while granola contains 257mg. Jerky has a lower glycemic index. The glycemic index of jerky is 0, while the glycemic index of granola is 53. The food types used in this comparison are Snacks, beef jerky, chopped, and formed and Cereals ready-to-eat, KELLOGG, KELLOGG'S Low Fat Granola without Raisins .
Infographic
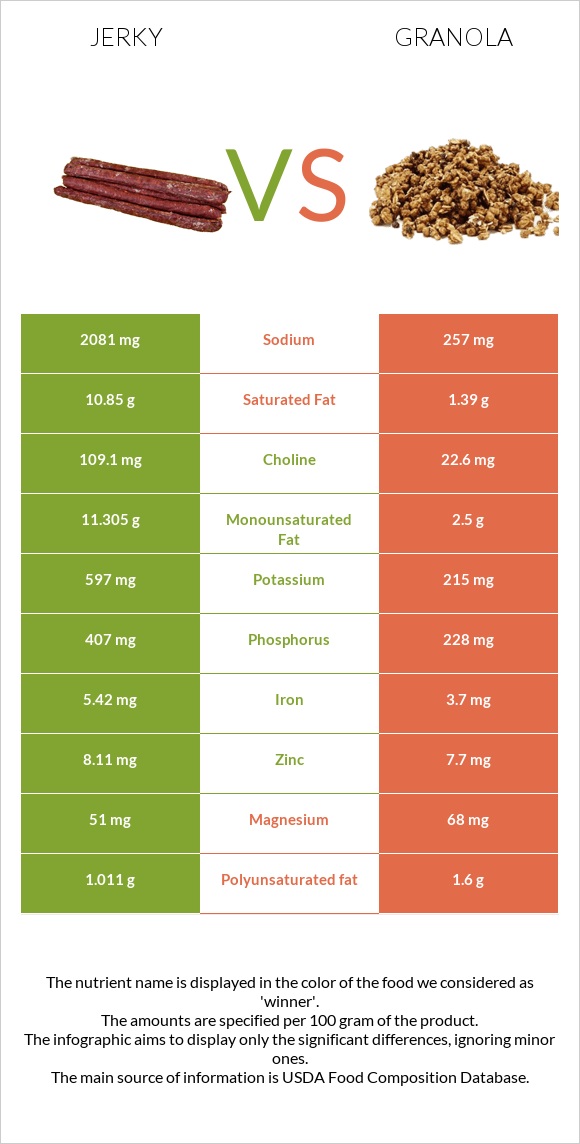
Mineral Comparison
Mineral comparison score is based on the number of minerals by which one or the other food is richer. The "coverage" charts below show how much of the daily needs can be covered by 300 grams of the food.
4
100 g
300 g
1 piece, large - 20g 1 oz - 28.35g 1 oz - 28.35g
Magnesium
Magnesium
Calcium
Calcium
Potassium
Potassium
Iron
Iron
Copper
Copper
Zinc
Zinc
Phosphorus
Phosphorus
Sodium
Sodium
Manganese
Manganese
Selenium
Selenium
36%
6%
53%
203%
76%
221%
174%
271%
14%
58%
5
100 g
300 g
0.5 cup (1 NLEA serving) - 49g
Magnesium
Magnesium
Calcium
Calcium
Potassium
Potassium
Iron
Iron
Copper
Copper
Zinc
Zinc
Phosphorus
Phosphorus
Sodium
Sodium
Manganese
Manganese
Selenium
Selenium
49%
9.9%
19%
139%
200%
210%
98%
34%
0%
94%
Vitamin Comparison
Vitamin comparison score is based on the number of vitamins by which one or the other food is richer. The "coverage" charts below show how much of the daily needs can be covered by 300 grams of the food.
2
100 g
300 g
1 piece, large - 20g 1 oz - 28.35g 1 oz - 28.35g
Vitamin C
Vit. C
Vitamin D
Vit. D
Vitamin A
Vit. A
Vitamin E
Vit. E
Vitamin B1
Vit. B1
Vitamin B2
Vit. B2
Vitamin B3
Vit. B3
Vitamin B5
Vit. B5
Vitamin B6
Vit. B6
Vitamin B12
Vit. B12
Vitamin K
Vit. K
Folate
Folate
0%
4.5%
0%
9.8%
39%
33%
32%
9.8%
41%
124%
5.8%
101%
10
100 g
300 g
0.5 cup (1 NLEA serving) - 49g
Vitamin C
Vit. C
Vitamin D
Vit. D
Vitamin A
Vit. A
Vitamin E
Vit. E
Vitamin B1
Vit. B1
Vitamin B2
Vit. B2
Vitamin B3
Vit. B3
Vitamin B5
Vit. B5
Vitamin B6
Vit. B6
Vitamin B12
Vit. B12
Vitamin K
Vit. K
Folate
Folate
20%
32%
153%
49%
190%
201%
191%
0%
942%
1500%
3.3%
612%
All nutrients comparison - raw data values
Nutrient
DV% diff.
Vitamin B12
0.99µg
12µg
459%
Vitamin B6
0.179mg
4.08mg
300%
Folate
134µg
816µg
171%
Sodium
2081mg
257mg
79%
Vitamin B2
0.142mg
0.87mg
56%
Vitamin B3
1.732mg
10.2mg
53%
Vitamin A
0µg
459µg
51%
Vitamin B1
0.154mg
0.76mg
51%
Protein
33.2g
8.7g
49%
Saturated fat
10.85g
1.39g
43%
Copper
0.227mg
0.6mg
41%
Fats
25.6g
5.7g
31%
Phosphorus
407mg
228mg
26%
Carbs
11g
80.9g
23%
Iron
5.42mg
3.7mg
22%
Monounsaturated fat
11.305g
2.5g
22%
Fiber
1.8g
7g
21%
Cholesterol
48mg
0mg
16%
Choline
109.1mg
22.6mg
16%
Vitamin E
0.49mg
2.43mg
13%
Selenium
10.7µg
17.3µg
12%
Potassium
597mg
215mg
11%
Vitamin D*
11 IU
82 IU
9%
Vitamin D
0.3µg
2.1µg
9%
Vitamin C
0mg
6mg
7%
Manganese
0.111mg
5%
Magnesium
51mg
68mg
4%
Zinc
8.11mg
7.7mg
4%
Polyunsaturated fat
1.011g
1.6g
4%
Vitamin B5
0.163mg
3%
Calories
410kcal
389kcal
1%
Calcium
20mg
33mg
1%
Vitamin K
2.3µg
1.3µg
1%
Protein per 100 calories
8.1g
2.2g
N/A
Calories per 10 g protein
123kcal
447kcal
N/A
Weight per 100 calories
24g
26g
N/A
Unsaturated / Saturated Fat ratio
1.1
2.9
N/A
Net carbs
9.2g
73.9g
N/A
Sugar
9g
28.3g
N/A
Macronutrient Comparison
Macronutrient breakdown side-by-side comparison
4
33%
26%
11%
23%
7%
Protein:
33.2 g
Fats:
25.6 g
Carbs:
11 g
Water:
23.36 g
Other:
6.84 g
1
9%
6%
81%
4%
Protein:
8.7 g
Fats:
5.7 g
Carbs:
80.9 g
Water:
3.5 g
Other:
1.2 g
Contains
more
Protein Protein
+281.6%
Contains
more
Fats Fats
+349.1%
Contains
more
Water Water
+567.4%
Contains
more
Other Other
+470%
Contains
more
Carbs Carbs
+635.5%
Fat Type Comparison
Fat type breakdown side-by-side comparison
1
47%
49%
4%
Saturated fat:
Sat. Fat
10.85 g
Monounsaturated fat:
Mono. Fat
11.305 g
Polyunsaturated fat:
Poly. Fat
1.011 g
2
25%
46%
29%
Saturated fat:
Sat. Fat
1.39 g
Monounsaturated fat:
Mono. Fat
2.5 g
Polyunsaturated fat:
Poly. Fat
1.6 g
Contains
more
Mono. Fat Monounsaturated fat
+352.2%
Contains
less
Sat. Fat Saturated fat
-87.2%
Contains
more
Poly. Fat Polyunsaturated fat
+58.3%