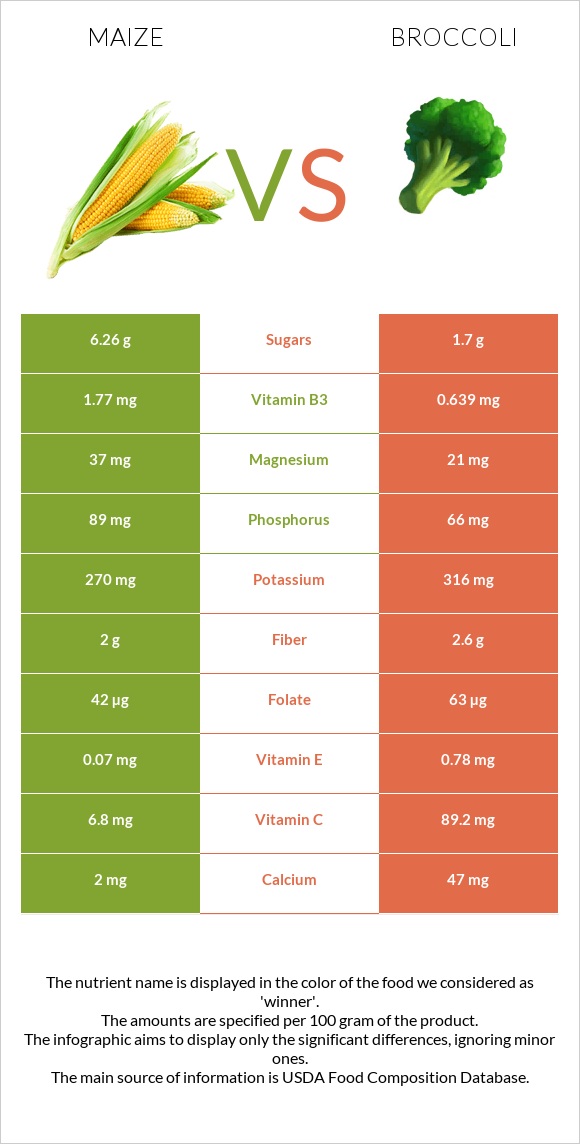
How are corn and broccoli different? Corn is richer in vitamin B3, while broccoli is higher in vitamin C, vitamin K, folate, and vitamin A. Broccoli covers your daily need for vitamin C, 93% more than corn. Corn contains 3 times more sugar than broccoli. Corn contains 4.54g of sugar, while broccoli contains 1.7g. Corn has a higher glycemic index (52) than broccoli (32). Corn, sweet, yellow, cooked, boiled, drained, without salt and Broccoli, raw types were used in this article.
Infographic
Mineral Comparison
Mineral comparison score is based on the number of minerals by which one or the other food is richer. The "coverage" charts below show how much of the daily needs can be covered by 300 grams of the food.
4
100 g
300 g
1 baby ear - 8g 1 ear small (5-1/2" to 6-1/2" long) - 89g 1 ear medium (6-3/4" to 7-1/2" long) - 103g 1 ear large (7-3/4" to 9" long) - 118g 1 cup cut - 149g
Magnesium
Magnesium
Calcium
Calcium
Potassium
Potassium
Iron
Iron
Copper
Copper
Zinc
Zinc
Phosphorus
Phosphorus
Sodium
Sodium
Manganese
Manganese
Selenium
Selenium
19%
0.9%
19%
17%
16%
17%
33%
0.13%
22%
1.1%
5
100 g
300 g
1 spear (about 5" long) - 31g 0.5 cup, chopped or diced - 44g 1 cup chopped - 91g 1 NLEA serving - 148g 1 stalk - 151g 1 bunch - 608g
Magnesium
Magnesium
Calcium
Calcium
Potassium
Potassium
Iron
Iron
Copper
Copper
Zinc
Zinc
Phosphorus
Phosphorus
Sodium
Sodium
Manganese
Manganese
Selenium
Selenium
15%
14%
28%
27%
16%
11%
28%
4.3%
27%
14%
Vitamin Comparison
Vitamin comparison score is based on the number of vitamins by which one or the other food is richer. The "coverage" charts below show how much of the daily needs can be covered by 300 grams of the food.
3
100 g
300 g
1 baby ear - 8g 1 ear small (5-1/2" to 6-1/2" long) - 89g 1 ear medium (6-3/4" to 7-1/2" long) - 103g 1 ear large (7-3/4" to 9" long) - 118g 1 cup cut - 149g
Vitamin C
Vit. C
Vitamin D
Vit. D
Vitamin A
Vit. A
Vitamin E
Vit. E
Vitamin B1
Vit. B1
Vitamin B2
Vit. B2
Vitamin B3
Vit. B3
Vitamin B5
Vit. B5
Vitamin B6
Vit. B6
Vitamin B12
Vit. B12
Vitamin K
Vit. K
Folate
Folate
18%
0%
4.3%
1.8%
23%
13%
32%
48%
32%
0%
1%
17%
7
100 g
300 g
1 spear (about 5" long) - 31g 0.5 cup, chopped or diced - 44g 1 cup chopped - 91g 1 NLEA serving - 148g 1 stalk - 151g 1 bunch - 608g
Vitamin C
Vit. C
Vitamin D
Vit. D
Vitamin A
Vit. A
Vitamin E
Vit. E
Vitamin B1
Vit. B1
Vitamin B2
Vit. B2
Vitamin B3
Vit. B3
Vitamin B5
Vit. B5
Vitamin B6
Vit. B6
Vitamin B12
Vit. B12
Vitamin K
Vit. K
Folate
Folate
297%
0%
10%
16%
18%
27%
12%
34%
40%
0%
254%
47%
All nutrients comparison - raw data values
Nutrient
DV% diff.
Vitamin C
5.5mg
89.2mg
93%
Vitamin K
0.4µg
101.6µg
84%
Folate
23µg
63µg
10%
Vitamin B3
1.683mg
0.639mg
7%
Carbs
20.98g
6.64g
5%
Vitamin E
0.09mg
0.78mg
5%
Vitamin B2
0.057mg
0.117mg
5%
Calcium
3mg
47mg
4%
Iron
0.45mg
0.73mg
4%
Selenium
0.2µg
2.5µg
4%
Vitamin B5
0.792mg
0.573mg
4%
Polyunsaturated fat
0.603g
0.038g
4%
Calories
96kcal
34kcal
3%
Potassium
218mg
316mg
3%
Starch
7.17g
0g
3%
Vitamin B6
0.139mg
0.175mg
3%
Fats
1.5g
0.37g
2%
Zinc
0.62mg
0.41mg
2%
Phosphorus
77mg
66mg
2%
Vitamin A
13µg
31µg
2%
Manganese
0.167mg
0.21mg
2%
Vitamin B1
0.093mg
0.071mg
2%
Choline
29.1mg
18.7mg
2%
Protein
3.41g
2.82g
1%
Magnesium
26mg
21mg
1%
Fiber
2.4g
2.6g
1%
Sodium
1mg
33mg
1%
Saturated fat
0.197g
0.039g
1%
Monounsaturated fat
0.374g
0.011g
1%
Protein per 100 calories
3.6g
8.3g
N/A
Calories per 10 g protein
282kcal
121kcal
N/A
Weight per 100 calories
104g
294g
N/A
Net carbs
18.58g
4.04g
N/A
Sugar
4.54g
1.7g
N/A
Copper
0.049mg
0.049mg
0%
Tryptophan
0.023mg
0.033mg
0%
Threonine
0.133mg
0.088mg
0%
Isoleucine
0.133mg
0.079mg
0%
Leucine
0.358mg
0.129mg
0%
Lysine
0.141mg
0.135mg
0%
Methionine
0.069mg
0.038mg
0%
Phenylalanine
0.155mg
0.117mg
0%
Valine
0.191mg
0.125mg
0%
Histidine
0.091mg
0.059mg
0%
Fructose
0.79g
0.68g
0%
Macronutrient Comparison
Macronutrient breakdown side-by-side comparison
3
3%
21%
73%
Protein:
3.41 g
Fats:
1.5 g
Carbs:
20.98 g
Water:
73.41 g
Other:
0.7 g
2
3%
7%
89%
Protein:
2.82 g
Fats:
0.37 g
Carbs:
6.64 g
Water:
89.3 g
Other:
0.87 g
Contains
more
Protein Protein
+20.9%
Contains
more
Fats Fats
+305.4%
Contains
more
Carbs Carbs
+216%
Contains
more
Water Water
+21.6%
Contains
more
Other Other
+24.3%
Fat Type Comparison
Fat type breakdown side-by-side comparison
2
17%
32%
51%
Saturated fat:
Sat. Fat
0.197 g
Monounsaturated fat:
Mono. Fat
0.374 g
Polyunsaturated fat:
Poly. Fat
0.603 g
1
44%
13%
43%
Saturated fat:
Sat. Fat
0.039 g
Monounsaturated fat:
Mono. Fat
0.011 g
Polyunsaturated fat:
Poly. Fat
0.038 g
Contains
more
Mono. Fat Monounsaturated fat
+3300%
Contains
more
Poly. Fat Polyunsaturated fat
+1486.8%
Contains
less
Sat. Fat Saturated fat
-80.2%
Carbohydrate type comparison
Carbohydrate type breakdown side-by-side comparison
4
61%
23%
7%
7%
Starch:
7.17 g
Sucrose:
2.74 g
Glucose:
0.84 g
Fructose:
0.79 g
Lactose:
0 g
Maltose:
0.17 g
Galactose:
0 g
2
6%
29%
40%
12%
12%
Starch:
0 g
Sucrose:
0.1 g
Glucose:
0.49 g
Fructose:
0.68 g
Lactose:
0.21 g
Maltose:
0.21 g
Galactose:
0 g
Contains
more
Starch Starch
+∞%
Contains
more
Sucrose Sucrose
+2640%
Contains
more
Glucose Glucose
+71.4%
Contains
more
Fructose Fructose
+16.2%
Contains
more
Lactose Lactose
+∞%
Contains
more
Maltose Maltose
+23.5%