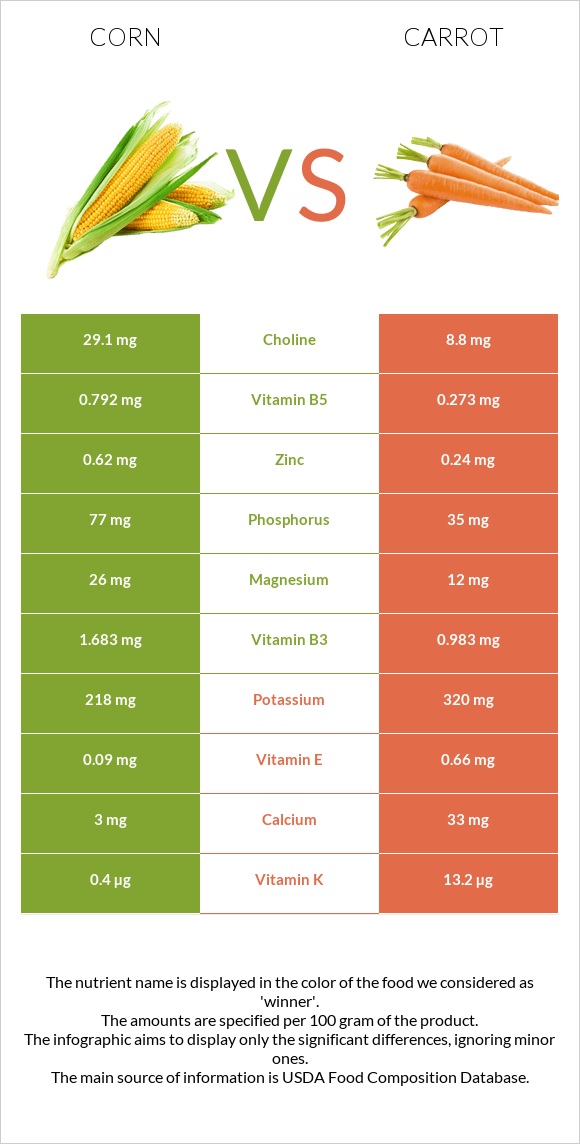
Important differences between corn and carrots Corn has more vitamin B5 and phosphorus; however, carrots have more vitamin A and vitamin K. Carrots' daily need coverage for vitamin A is 329% more. Corn has 3 times more choline than carrots. Corn has 29.1mg of choline, while carrots have 8.8mg. Corn has a higher glycemic index than carrots. The food varieties used in the comparison are Corn, sweet, yellow, cooked, boiled, drained, without salt and Carrots, raw .
Infographic
Mineral Comparison
Mineral comparison score is based on the number of minerals by which one or the other food is richer. The "coverage" charts below show how much of the daily needs can be covered by 300 grams of the food.
7
100 g
300 g
1 baby ear - 8g 1 ear small (5-1/2" to 6-1/2" long) - 89g 1 ear medium (6-3/4" to 7-1/2" long) - 103g 1 ear large (7-3/4" to 9" long) - 118g 1 cup cut - 149g
Magnesium
Magnesium
Calcium
Calcium
Potassium
Potassium
Iron
Iron
Copper
Copper
Zinc
Zinc
Phosphorus
Phosphorus
Sodium
Sodium
Manganese
Manganese
Selenium
Selenium
19%
0.9%
19%
17%
16%
17%
33%
0.13%
22%
1.1%
2
100 g
300 g
1 slice - 3g 1 strip medium - 4g 1 strip large (3" long) - 7g 1 small (5-1/2" long) - 50g 1 medium - 61g 1 large (7-1/4" to 8-/1/2" long) - 72g 1 cup grated - 110g 1 cup strips or slices - 122g 1 cup chopped - 128g
Magnesium
Magnesium
Calcium
Calcium
Potassium
Potassium
Iron
Iron
Copper
Copper
Zinc
Zinc
Phosphorus
Phosphorus
Sodium
Sodium
Manganese
Manganese
Selenium
Selenium
8.6%
9.9%
28%
11%
15%
6.5%
15%
9%
19%
0.55%
Vitamin Comparison
Vitamin comparison score is based on the number of vitamins by which one or the other food is richer. The "coverage" charts below show how much of the daily needs can be covered by 300 grams of the food.
4
100 g
300 g
1 baby ear - 8g 1 ear small (5-1/2" to 6-1/2" long) - 89g 1 ear medium (6-3/4" to 7-1/2" long) - 103g 1 ear large (7-3/4" to 9" long) - 118g 1 cup cut - 149g
Vitamin C
Vit. C
Vitamin D
Vit. D
Vitamin A
Vit. A
Vitamin E
Vit. E
Vitamin B1
Vit. B1
Vitamin B2
Vit. B2
Vitamin B3
Vit. B3
Vitamin B5
Vit. B5
Vitamin B6
Vit. B6
Vitamin B12
Vit. B12
Vitamin K
Vit. K
Folate
Folate
18%
0%
4.3%
1.8%
23%
13%
32%
48%
32%
0%
1%
17%
3
100 g
300 g
1 slice - 3g 1 strip medium - 4g 1 strip large (3" long) - 7g 1 small (5-1/2" long) - 50g 1 medium - 61g 1 large (7-1/4" to 8-/1/2" long) - 72g 1 cup grated - 110g 1 cup strips or slices - 122g 1 cup chopped - 128g
Vitamin C
Vit. C
Vitamin D
Vit. D
Vitamin A
Vit. A
Vitamin E
Vit. E
Vitamin B1
Vit. B1
Vitamin B2
Vit. B2
Vitamin B3
Vit. B3
Vitamin B5
Vit. B5
Vitamin B6
Vit. B6
Vitamin B12
Vit. B12
Vitamin K
Vit. K
Folate
Folate
20%
0%
278%
13%
17%
13%
18%
16%
32%
0%
33%
14%
All nutrients comparison - raw data values
Nutrient
DV% diff.
Vitamin A
13µg
835µg
91%
Vitamin K
0.4µg
13.2µg
11%
Vitamin B5
0.792mg
0.273mg
10%
Phosphorus
77mg
35mg
6%
Protein
3.41g
0.93g
5%
Carbs
20.98g
9.58g
4%
Vitamin E
0.09mg
0.66mg
4%
Vitamin B3
1.683mg
0.983mg
4%
Choline
29.1mg
8.8mg
4%
Calories
96kcal
41kcal
3%
Magnesium
26mg
12mg
3%
Calcium
3mg
33mg
3%
Potassium
218mg
320mg
3%
Zinc
0.62mg
0.24mg
3%
Sodium
1mg
69mg
3%
Polyunsaturated fat
0.603g
0.117g
3%
Fats
1.5g
0.24g
2%
Iron
0.45mg
0.3mg
2%
Fiber
2.4g
2.8g
2%
Starch
7.17g
1.43g
2%
Vitamin B1
0.093mg
0.066mg
2%
Manganese
0.167mg
0.143mg
1%
Folate
23µg
19µg
1%
Saturated fat
0.197g
0.037g
1%
Monounsaturated fat
0.374g
0.014g
1%
Protein per 100 calories
3.6g
2.3g
N/A
Calories per 10 g protein
282kcal
441kcal
N/A
Weight per 100 calories
104g
244g
N/A
Vitamin C
5.5mg
5.9mg
0%
Net carbs
18.58g
6.78g
N/A
Sugar
4.54g
4.74g
N/A
Copper
0.049mg
0.045mg
0%
Selenium
0.2µg
0.1µg
0%
Vitamin B2
0.057mg
0.058mg
0%
Vitamin B6
0.139mg
0.138mg
0%
Tryptophan
0.023mg
0.012mg
0%
Threonine
0.133mg
0.191mg
0%
Isoleucine
0.133mg
0.077mg
0%
Leucine
0.358mg
0.102mg
0%
Lysine
0.141mg
0.101mg
0%
Methionine
0.069mg
0.02mg
0%
Phenylalanine
0.155mg
0.061mg
0%
Valine
0.191mg
0.069mg
0%
Histidine
0.091mg
0.04mg
0%
Fructose
0.79g
0.55g
0%
Macronutrient Comparison
Macronutrient breakdown side-by-side comparison
3
3%
21%
73%
Protein:
3.41 g
Fats:
1.5 g
Carbs:
20.98 g
Water:
73.41 g
Other:
0.7 g
2
10%
88%
Protein:
0.93 g
Fats:
0.24 g
Carbs:
9.58 g
Water:
88.29 g
Other:
0.96 g
Contains
more
Protein Protein
+266.7%
Contains
more
Fats Fats
+525%
Contains
more
Carbs Carbs
+119%
Contains
more
Water Water
+20.3%
Contains
more
Other Other
+37.1%
Fat Type Comparison
Fat type breakdown side-by-side comparison
2
17%
32%
51%
Saturated fat:
Sat. Fat
0.197 g
Monounsaturated fat:
Mono. Fat
0.374 g
Polyunsaturated fat:
Poly. Fat
0.603 g
1
22%
8%
70%
Saturated fat:
Sat. Fat
0.037 g
Monounsaturated fat:
Mono. Fat
0.014 g
Polyunsaturated fat:
Poly. Fat
0.117 g
Contains
more
Mono. Fat Monounsaturated fat
+2571.4%
Contains
more
Poly. Fat Polyunsaturated fat
+415.4%
Contains
less
Sat. Fat Saturated fat
-81.2%
Carbohydrate type comparison
Carbohydrate type breakdown side-by-side comparison
4
61%
23%
7%
7%
Starch:
7.17 g
Sucrose:
2.74 g
Glucose:
0.84 g
Fructose:
0.79 g
Lactose:
0 g
Maltose:
0.17 g
Galactose:
0 g
1
23%
58%
10%
9%
Starch:
1.43 g
Sucrose:
3.59 g
Glucose:
0.59 g
Fructose:
0.55 g
Lactose:
0 g
Maltose:
0 g
Galactose:
0 g
Contains
more
Starch Starch
+401.4%
Contains
more
Glucose Glucose
+42.4%
Contains
more
Fructose Fructose
+43.6%
Contains
more
Maltose Maltose
+∞%
Contains
more
Sucrose Sucrose
+31%
~equal in
Lactose
~0g
~equal in
Galactose
~0g