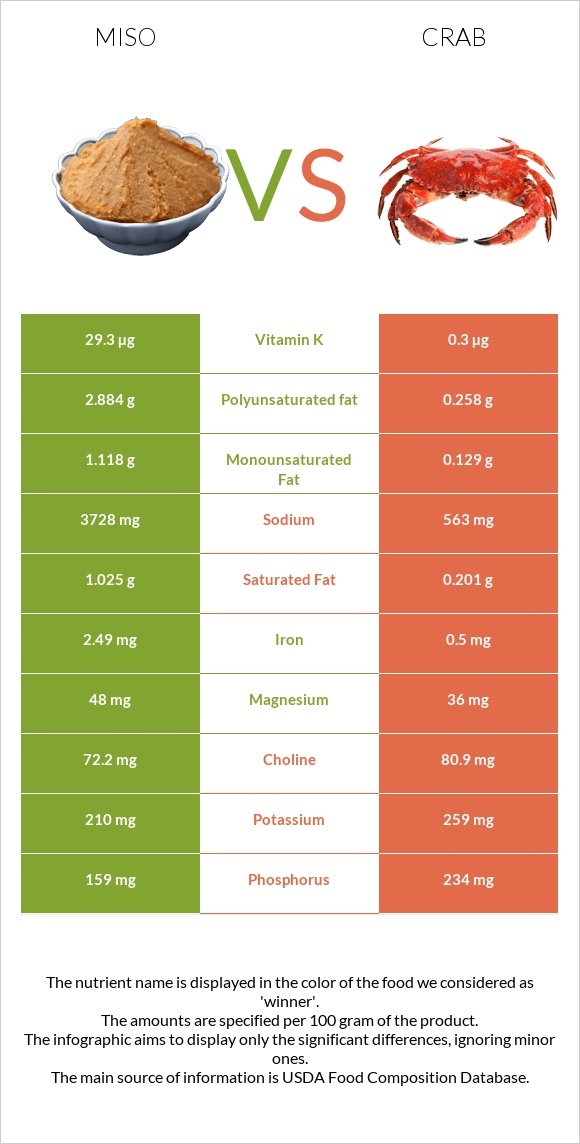
Summary of differences between miso and crab Miso has more manganese, iron, vitamin K, and fiber, while crab has more vitamin B12, selenium, copper, and vitamin B5. Miso covers your daily need for sodium, 138% more than crab. The amount of sodium in crab is lower. Crab has a lower glycemic index. The glycemic index of crab is 0, while the glycemic index of miso is 61. These are the specific foods used in this comparison Miso and Crustaceans, crab, blue, canned .
Infographic
Mineral Comparison
Mineral comparison score is based on the number of minerals by which one or the other food is richer. The "coverage" charts below show how much of the daily needs can be covered by 300 grams of the food.
3
100 g
300 g
1 tbsp - 17g 1 cup - 275g
Magnesium
Magnesium
Calcium
Calcium
Potassium
Potassium
Iron
Iron
Copper
Copper
Zinc
Zinc
Phosphorus
Phosphorus
Sodium
Sodium
Manganese
Manganese
Selenium
Selenium
34%
17%
19%
93%
140%
70%
68%
486%
112%
38%
7
100 g
300 g
1 oz - 28.35g 3 oz - 85g 1 can (6.5 oz), drained - 125g 1 cup - 135g
Magnesium
Magnesium
Calcium
Calcium
Potassium
Potassium
Iron
Iron
Copper
Copper
Zinc
Zinc
Phosphorus
Phosphorus
Sodium
Sodium
Manganese
Manganese
Selenium
Selenium
26%
27%
23%
19%
271%
104%
100%
73%
9.7%
234%
Vitamin Comparison
Vitamin comparison score is based on the number of vitamins by which one or the other food is richer. The "coverage" charts below show how much of the daily needs can be covered by 300 grams of the food.
5
100 g
300 g
1 tbsp - 17g 1 cup - 275g
Vitamin C
Vit. C
Vitamin D
Vit. D
Vitamin A
Vit. A
Vitamin E
Vit. E
Vitamin B1
Vit. B1
Vitamin B2
Vit. B2
Vitamin B3
Vit. B3
Vitamin B5
Vit. B5
Vitamin B6
Vit. B6
Vitamin B12
Vit. B12
Vitamin K
Vit. K
Folate
Folate
0%
0%
1.3%
0.2%
25%
54%
17%
20%
46%
10%
73%
14%
6
100 g
300 g
1 oz - 28.35g 3 oz - 85g 1 can (6.5 oz), drained - 125g 1 cup - 135g
Vitamin C
Vit. C
Vitamin D
Vit. D
Vitamin A
Vit. A
Vitamin E
Vit. E
Vitamin B1
Vit. B1
Vitamin B2
Vit. B2
Vitamin B3
Vit. B3
Vitamin B5
Vit. B5
Vitamin B6
Vit. B6
Vitamin B12
Vit. B12
Vitamin K
Vit. K
Folate
Folate
11%
0%
0.33%
37%
5.8%
21%
52%
60%
36%
416%
0.75%
38%
All nutrients comparison - raw data values
Nutrient
DV% diff.
Sodium
3728mg
563mg
138%
Vitamin B12
0.08µg
3.33µg
135%
Selenium
7µg
42.9µg
65%
Copper
0.42mg
0.814mg
44%
Manganese
0.859mg
0.074mg
34%
Cholesterol
0mg
97mg
32%
Iron
2.49mg
0.5mg
25%
Vitamin K
29.3µg
0.3µg
24%
Fiber
5.4g
0g
22%
Polyunsaturated fat
2.884g
0.258g
18%
Vitamin B5
0.337mg
0.997mg
13%
Vitamin E
0.01mg
1.84mg
12%
Vitamin B3
0.906mg
2.747mg
12%
Zinc
2.56mg
3.81mg
11%
Phosphorus
159mg
234mg
11%
Vitamin B2
0.233mg
0.093mg
11%
Protein
12.79g
17.88g
10%
Fats
6.01g
0.74g
8%
Carbs
25.37g
0g
8%
Folate
19µg
51µg
8%
Fructose
6g
0g
8%
Calories
198kcal
83kcal
6%
Vitamin B1
0.098mg
0.023mg
6%
Vitamin C
0mg
3.3mg
4%
Saturated fat
1.025g
0.201g
4%
Magnesium
48mg
36mg
3%
Calcium
57mg
91mg
3%
Vitamin B6
0.199mg
0.156mg
3%
Choline
72.2mg
80.9mg
2%
Monounsaturated fat
1.118g
0.129g
2%
Potassium
210mg
259mg
1%
Protein per 100 calories
6.5g
22g
N/A
Calories per 10 g protein
155kcal
46kcal
N/A
Weight per 100 calories
51g
120g
N/A
Unsaturated / Saturated Fat ratio
3.9
1.9
N/A
Net carbs
19.97g
0g
N/A
Sugar
6.2g
0g
N/A
Vitamin A
4µg
1µg
0%
Trans fat
0g
0.014g
N/A
Tryptophan
0.155mg
0.226mg
0%
Threonine
0.479mg
0.727mg
0%
Isoleucine
0.508mg
0.776mg
0%
Leucine
0.82mg
1.307mg
0%
Lysine
0.478mg
1.386mg
0%
Methionine
0.129mg
0.452mg
0%
Phenylalanine
0.486mg
0.708mg
0%
Valine
0.547mg
0.806mg
0%
Histidine
0.243mg
0.393mg
0%
Omega-3 - EPA
0g
0.101g
N/A
Omega-3 - DHA
0g
0.067g
N/A
Omega-3 - DPA
0g
0.009g
N/A
Omega-6 - Eicosadienoic acid
0g
0.005g
N/A
Macronutrient Comparison
Macronutrient breakdown side-by-side comparison
3
13%
6%
25%
43%
13%
Protein:
12.79 g
Fats:
6.01 g
Carbs:
25.37 g
Water:
43.02 g
Other:
12.81 g
2
18%
80%
2%
Protein:
17.88 g
Fats:
0.74 g
Carbs:
0 g
Water:
79.69 g
Other:
1.69 g
Contains
more
Fats Fats
+712.2%
Contains
more
Carbs Carbs
+∞%
Contains
more
Other Other
+658%
Contains
more
Protein Protein
+39.8%
Contains
more
Water Water
+85.2%
Fat Type Comparison
Fat type breakdown side-by-side comparison
2
20%
22%
57%
Saturated fat:
Sat. Fat
1.025 g
Monounsaturated fat:
Mono. Fat
1.118 g
Polyunsaturated fat:
Poly. Fat
2.884 g
1
34%
22%
44%
Saturated fat:
Sat. Fat
0.201 g
Monounsaturated fat:
Mono. Fat
0.129 g
Polyunsaturated fat:
Poly. Fat
0.258 g
Contains
more
Mono. Fat Monounsaturated fat
+766.7%
Contains
more
Poly. Fat Polyunsaturated fat
+1017.8%
Contains
less
Sat. Fat Saturated fat
-80.4%