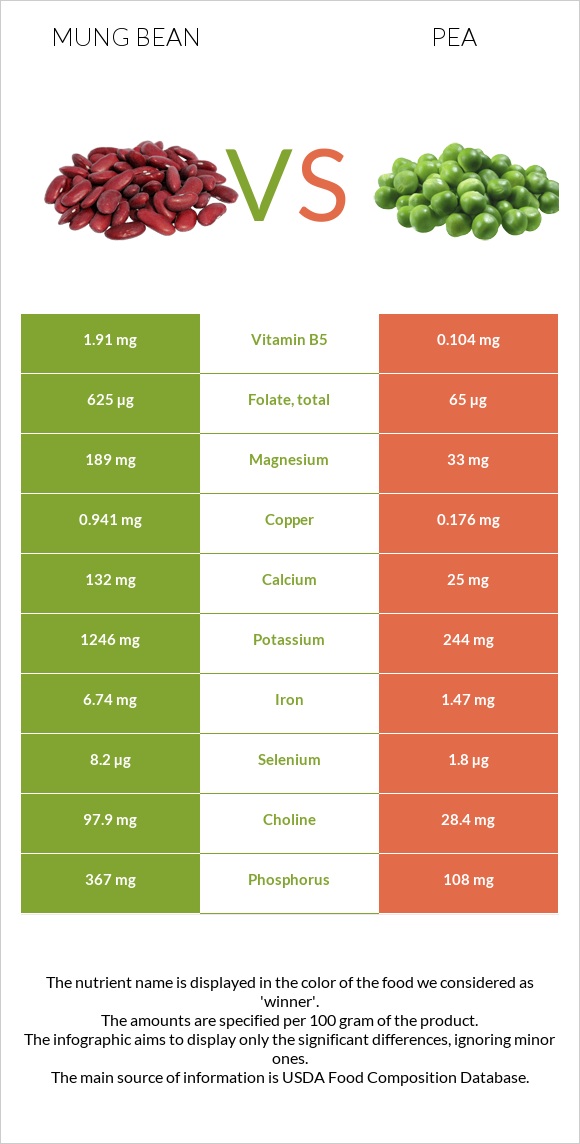
A recap on the differences between mung beans and peas Mung beans have more folate, copper, iron, fiber, phosphorus, magnesium, vitamin B1, potassium, and manganese; however, peas are higher in vitamin B5. Peas cover your daily vitamin B5 needs 3022% more than mung beans. Peas contain 10 times less folate than mung beans. Mung beans contain 625µg of folate, while peas contain 63µg. The glycemic index of peas is higher. Food varieties used in this article are Mung beans, mature seeds, raw and Peas, green, cooked, boiled, drained, without salt .
Infographic
Mineral Comparison
Mineral comparison score is based on the number of minerals by which one or the other food is richer. The "coverage" charts below show how much of the daily needs can be covered by 300 grams of the food.
9
100 g
300 g
1 tbsp - 13g 1 cup - 207g
Magnesium
Magnesium
Calcium
Calcium
Potassium
Potassium
Iron
Iron
Copper
Copper
Zinc
Zinc
Phosphorus
Phosphorus
Sodium
Sodium
Manganese
Manganese
Selenium
Selenium
135%
40%
110%
253%
314%
73%
157%
2%
135%
45%
1
100 g
300 g
1 cup - 160g
Magnesium
Magnesium
Calcium
Calcium
Potassium
Potassium
Iron
Iron
Copper
Copper
Zinc
Zinc
Phosphorus
Phosphorus
Sodium
Sodium
Manganese
Manganese
Selenium
Selenium
28%
8.1%
24%
58%
58%
32%
50%
0.39%
68%
10%
Vitamin Comparison
Vitamin comparison score is based on the number of vitamins by which one or the other food is richer. The "coverage" charts below show how much of the daily needs can be covered by 300 grams of the food.
6
100 g
300 g
1 tbsp - 13g 1 cup - 207g
Vitamin C
Vit. C
Vitamin D
Vit. D
Vitamin A
Vit. A
Vitamin E
Vit. E
Vitamin B1
Vit. B1
Vitamin B2
Vit. B2
Vitamin B3
Vit. B3
Vitamin B5
Vit. B5
Vitamin B6
Vit. B6
Vitamin B12
Vit. B12
Vitamin K
Vit. K
Folate
Folate
16%
0%
2%
10%
155%
54%
42%
115%
88%
0%
23%
469%
4
100 g
300 g
1 cup - 160g
Vitamin C
Vit. C
Vitamin D
Vit. D
Vitamin A
Vit. A
Vitamin E
Vit. E
Vitamin B1
Vit. B1
Vitamin B2
Vit. B2
Vitamin B3
Vit. B3
Vitamin B5
Vit. B5
Vitamin B6
Vit. B6
Vitamin B12
Vit. B12
Vitamin K
Vit. K
Folate
Folate
47%
0%
13%
2.8%
65%
34%
38%
9180%
50%
0%
65%
47%
All nutrients comparison - raw data values
Nutrient
DV% diff.
Vitamin B5
1.91mg
153mg
3022%
Folate
625µg
63µg
141%
Copper
0.941mg
0.173mg
85%
Iron
6.74mg
1.54mg
65%
Fiber
16.3g
5.5g
43%
Protein
23.86g
5.36g
37%
Magnesium
189mg
39mg
36%
Phosphorus
367mg
117mg
36%
Vitamin B1
0.621mg
0.259mg
30%
Potassium
1246mg
271mg
29%
Manganese
1.035mg
0.525mg
22%
Carbs
62.62g
15.63g
16%
Zinc
2.68mg
1.19mg
14%
Vitamin K
9µg
25.9µg
14%
Calories
347kcal
84kcal
13%
Vitamin B6
0.382mg
0.216mg
13%
Choline
97.9mg
29.7mg
12%
Calcium
132mg
27mg
11%
Selenium
8.2µg
1.9µg
11%
Vitamin C
4.8mg
14.2mg
10%
Vitamin B2
0.233mg
0.149mg
6%
Vitamin A
6µg
40µg
4%
Vitamin E
0.51mg
0.14mg
2%
Polyunsaturated fat
0.384g
0.102g
2%
Fats
1.15g
0.22g
1%
Sodium
15mg
3mg
1%
Vitamin B3
2.251mg
2.021mg
1%
Saturated fat
0.348g
0.039g
1%
Fructose
0.41g
1%
Protein per 100 calories
6.9g
6.4g
N/A
Calories per 10 g protein
145kcal
157kcal
N/A
Weight per 100 calories
29g
119g
N/A
Net carbs
46.32g
10.13g
N/A
Sugar
6.6g
5.93g
N/A
Monounsaturated fat
0.161g
0.019g
0%
Tryptophan
0.26mg
0.037mg
0%
Threonine
0.782mg
0.201mg
0%
Isoleucine
1.008mg
0.193mg
0%
Leucine
1.847mg
0.32mg
0%
Lysine
1.664mg
0.314mg
0%
Methionine
0.286mg
0.081mg
0%
Phenylalanine
1.443mg
0.198mg
0%
Valine
1.237mg
0.232mg
0%
Histidine
0.695mg
0.105mg
0%
Macronutrient Comparison
Macronutrient breakdown side-by-side comparison
4
24%
63%
9%
3%
Protein:
23.86 g
Fats:
1.15 g
Carbs:
62.62 g
Water:
9.05 g
Other:
3.32 g
1
5%
16%
78%
Protein:
5.36 g
Fats:
0.22 g
Carbs:
15.63 g
Water:
77.87 g
Other:
0.92 g
Contains
more
Protein Protein
+345.1%
Contains
more
Fats Fats
+422.7%
Contains
more
Carbs Carbs
+300.6%
Contains
more
Other Other
+260.9%
Contains
more
Water Water
+760.4%
Fat Type Comparison
Fat type breakdown side-by-side comparison
2
39%
18%
43%
Saturated fat:
Sat. Fat
0.348 g
Monounsaturated fat:
Mono. Fat
0.161 g
Polyunsaturated fat:
Poly. Fat
0.384 g
1
24%
12%
64%
Saturated fat:
Sat. Fat
0.039 g
Monounsaturated fat:
Mono. Fat
0.019 g
Polyunsaturated fat:
Poly. Fat
0.102 g
Contains
more
Mono. Fat Monounsaturated fat
+747.4%
Contains
more
Poly. Fat Polyunsaturated fat
+276.5%
Contains
less
Sat. Fat Saturated fat
-88.8%