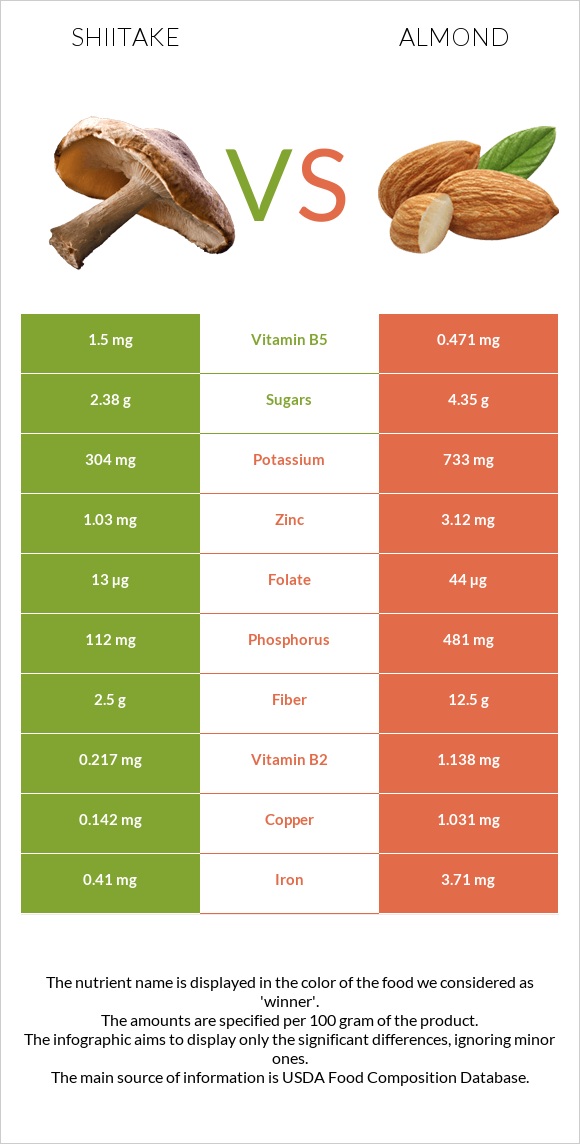
How are shiitake and almonds different? Shiitake is higher in vitamin B5; however, almonds are richer in copper, manganese, vitamin B2, magnesium, phosphorus, iron, fiber, calcium, and zinc. Daily need coverage for copper for almonds is 99% higher. Shiitake contains 3 times more vitamin B5 than almonds. While shiitake contains 1.5mg of vitamin B5, almonds contain only 0.471mg. Almonds have a lower glycemic index (0) than shiitake (32). Mushrooms, shiitake, raw and Nuts, almonds are the varieties used in this article.
Infographic
Mineral Comparison
Mineral comparison score is based on the number of minerals by which one or the other food is richer. The "coverage" charts below show how much of the daily needs can be covered by 300 grams of the food.
1
100 g
300 g
1 piece whole - 19g
Magnesium
Magnesium
Calcium
Calcium
Potassium
Potassium
Iron
Iron
Copper
Copper
Zinc
Zinc
Phosphorus
Phosphorus
Sodium
Sodium
Manganese
Manganese
Selenium
Selenium
14%
0.6%
27%
15%
47%
28%
48%
1.2%
30%
31%
9
100 g
300 g
1 almond - 1.2g 1 oz (23 whole kernels) - 28.35g 1 cup, sliced - 92g 1 cup, ground - 95g 1 cup, slivered - 108g 1 cup, whole - 143g
Magnesium
Magnesium
Calcium
Calcium
Potassium
Potassium
Iron
Iron
Copper
Copper
Zinc
Zinc
Phosphorus
Phosphorus
Sodium
Sodium
Manganese
Manganese
Selenium
Selenium
193%
81%
65%
139%
344%
85%
206%
0.13%
284%
22%
Vitamin Comparison
Vitamin comparison score is based on the number of vitamins by which one or the other food is richer. The "coverage" charts below show how much of the daily needs can be covered by 300 grams of the food.
3
100 g
300 g
1 piece whole - 19g
Vitamin C
Vit. C
Vitamin D
Vit. D
Vitamin A
Vit. A
Vitamin E
Vit. E
Vitamin B1
Vit. B1
Vitamin B2
Vit. B2
Vitamin B3
Vit. B3
Vitamin B5
Vit. B5
Vitamin B6
Vit. B6
Vitamin B12
Vit. B12
Vitamin K
Vit. K
Folate
Folate
0%
6%
0%
0%
3.8%
50%
73%
90%
68%
0%
0%
9.8%
4
100 g
300 g
1 almond - 1.2g 1 oz (23 whole kernels) - 28.35g 1 cup, sliced - 92g 1 cup, ground - 95g 1 cup, slivered - 108g 1 cup, whole - 143g
Vitamin C
Vit. C
Vitamin D
Vit. D
Vitamin A
Vit. A
Vitamin E
Vit. E
Vitamin B1
Vit. B1
Vitamin B2
Vit. B2
Vitamin B3
Vit. B3
Vitamin B5
Vit. B5
Vitamin B6
Vit. B6
Vitamin B12
Vit. B12
Vitamin K
Vit. K
Folate
Folate
0%
0%
0%
513%
51%
263%
68%
28%
32%
0%
0%
33%
All nutrients comparison - raw data values
Nutrient
DV% diff.
Vitamin E
25.63mg
171%
Copper
0.142mg
1.031mg
99%
Manganese
0.23mg
2.179mg
85%
Polyunsaturated fat
12.329g
82%
Monounsaturated fat
31.551g
79%
Fats
0.49g
49.93g
76%
Vitamin B2
0.217mg
1.138mg
71%
Magnesium
20mg
270mg
60%
Phosphorus
112mg
481mg
53%
Iron
0.41mg
3.71mg
41%
Fiber
2.5g
12.5g
40%
Protein
2.24g
21.15g
38%
Calories
34kcal
579kcal
27%
Calcium
2mg
269mg
27%
Vitamin B5
1.5mg
0.471mg
21%
Zinc
1.03mg
3.12mg
19%
Saturated fat
3.802g
17%
Vitamin B1
0.015mg
0.205mg
16%
Potassium
304mg
733mg
13%
Vitamin B6
0.293mg
0.137mg
12%
Choline
52.1mg
9%
Folate
13µg
44µg
8%
Carbs
6.79g
21.55g
5%
Selenium
5.7µg
4.1µg
3%
Vitamin D*
18 IU
0 IU
2%
Vitamin D
0.4µg
0µg
2%
Vitamin B3
3.877mg
3.618mg
2%
Protein per 100 calories
6.6g
3.7g
N/A
Calories per 10 g protein
152kcal
274kcal
N/A
Weight per 100 calories
294g
17g
N/A
Unsaturated / Saturated Fat ratio
12
N/A
Net carbs
4.29g
9.05g
N/A
Sugar
2.38g
4.35g
N/A
Starch
0.72g
0%
Sodium
9mg
1mg
0%
Trans fat
0g
0.015g
N/A
Tryptophan
0.011mg
0.211mg
0%
Threonine
0.134mg
0.601mg
0%
Isoleucine
0.111mg
0.751mg
0%
Leucine
0.189mg
1.473mg
0%
Lysine
0.134mg
0.568mg
0%
Methionine
0.033mg
0.157mg
0%
Phenylalanine
0.111mg
1.132mg
0%
Valine
0.145mg
0.855mg
0%
Histidine
0.056mg
0.539mg
0%
Fructose
0g
0.11g
0%
Omega-3 - ALA
0.003g
N/A
Omega-6 - Eicosadienoic acid
0.002g
N/A
Omega-6 - Linoleic acid
12.32g
N/A
Macronutrient Comparison
Macronutrient breakdown side-by-side comparison
1
2%
7%
90%
Protein:
2.24 g
Fats:
0.49 g
Carbs:
6.79 g
Water:
89.74 g
Other:
0.74 g
4
21%
50%
22%
4%
3%
Protein:
21.15 g
Fats:
49.93 g
Carbs:
21.55 g
Water:
4.41 g
Other:
2.96 g
Contains
more
Water Water
+1934.9%
Contains
more
Protein Protein
+844.2%
Contains
more
Fats Fats
+10089.8%
Contains
more
Carbs Carbs
+217.4%
Contains
more
Other Other
+300%
Carbohydrate type comparison
Carbohydrate type breakdown side-by-side comparison
1
100%
Starch:
0 g
Sucrose:
0 g
Glucose:
2.38 g
Fructose:
0 g
Lactose:
0 g
Maltose:
0 g
Galactose:
0 g
5
14%
78%
3%
2%
Starch:
0.72 g
Sucrose:
3.95 g
Glucose:
0.17 g
Fructose:
0.11 g
Lactose:
0 g
Maltose:
0.04 g
Galactose:
0.07 g
Contains
more
Glucose Glucose
+1300%
Contains
more
Starch Starch
+∞%
Contains
more
Sucrose Sucrose
+∞%
Contains
more
Fructose Fructose
+∞%
Contains
more
Maltose Maltose
+∞%
Contains
more
Galactose Galactose
+∞%