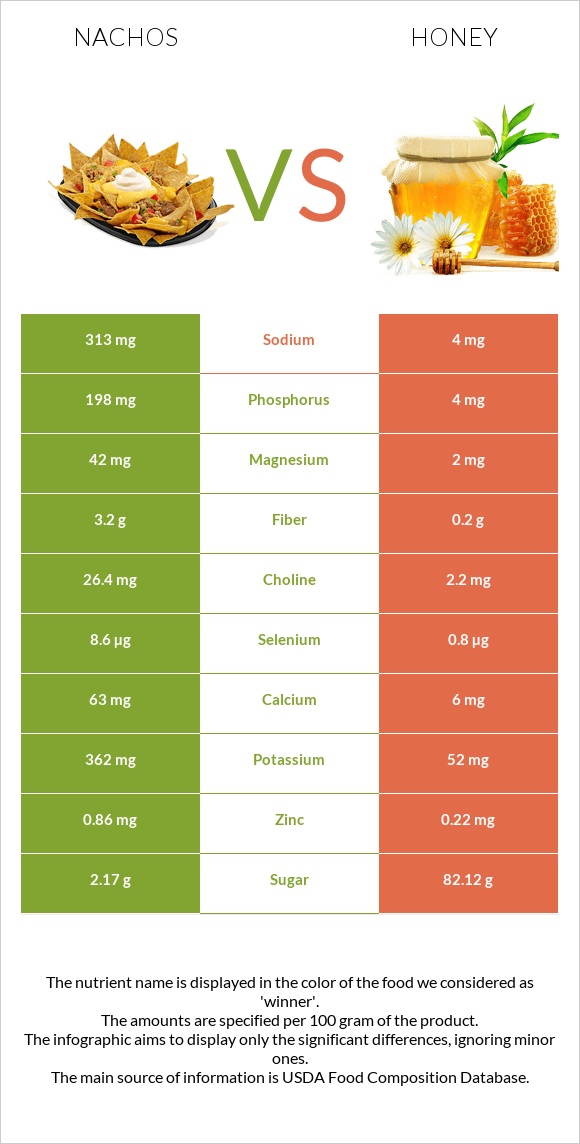
The main differences between nachos and honey Nachos are richer than honey in phosphorus, vitamin E, vitamin K, vitamin B6, selenium, fiber, vitamin B1, and magnesium. Daily need coverage for phosphorus for nachos is 28% higher. Honey contains less saturated fat. Honey has a lower glycemic index than nachos. Food types used in this article are Fast foods, nachos, with cheese and Honey .
Infographic
Mineral Comparison
Mineral comparison score is based on the number of minerals by which one or the other food is richer. The "coverage" charts below show how much of the daily needs can be covered by 300 grams of the food.
9
100 g
300 g
1 serving - 80g
Magnesium
Magnesium
Calcium
Calcium
Potassium
Potassium
Iron
Iron
Copper
Copper
Zinc
Zinc
Phosphorus
Phosphorus
Sodium
Sodium
Manganese
Manganese
Selenium
Selenium
30%
19%
32%
28%
21%
23%
85%
41%
24%
47%
1
100 g
300 g
1 packet (0.5 oz) - 14g 1 tbsp - 21g 1 cup - 339g
Magnesium
Magnesium
Calcium
Calcium
Potassium
Potassium
Iron
Iron
Copper
Copper
Zinc
Zinc
Phosphorus
Phosphorus
Sodium
Sodium
Manganese
Manganese
Selenium
Selenium
1.4%
1.8%
4.6%
16%
12%
6%
1.7%
0.52%
10%
4.4%
Vitamin Comparison
Vitamin comparison score is based on the number of vitamins by which one or the other food is richer. The "coverage" charts below show how much of the daily needs can be covered by 300 grams of the food.
11
100 g
300 g
1 serving - 80g
Vitamin C
Vit. C
Vitamin D
Vit. D
Vitamin A
Vit. A
Vitamin E
Vit. E
Vitamin B1
Vit. B1
Vitamin B2
Vit. B2
Vitamin B3
Vit. B3
Vitamin B5
Vit. B5
Vitamin B6
Vit. B6
Vitamin B12
Vit. B12
Vitamin K
Vit. K
Folate
Folate
3.7%
0%
1.7%
82%
31%
31%
12%
23%
50%
8.8%
48%
7.5%
0
100 g
300 g
1 packet (0.5 oz) - 14g 1 tbsp - 21g 1 cup - 339g
Vitamin C
Vit. C
Vitamin D
Vit. D
Vitamin A
Vit. A
Vitamin E
Vit. E
Vitamin B1
Vit. B1
Vitamin B2
Vit. B2
Vitamin B3
Vit. B3
Vitamin B5
Vit. B5
Vitamin B6
Vit. B6
Vitamin B12
Vit. B12
Vitamin K
Vit. K
Folate
Folate
1.7%
0%
0%
0%
0%
8.8%
2.3%
4.1%
5.5%
0%
0%
1.5%
All nutrients comparison - raw data values
Nutrient
DV% diff.
Fructose
0g
40.94g
51%
Monounsaturated fat
14.02g
0g
35%
Polyunsaturated fat
5.04g
0g
34%
Fats
21.5g
0g
33%
Phosphorus
198mg
4mg
28%
Vitamin E
4.08mg
0mg
27%
Carbs
34.91g
82.4g
16%
Vitamin K
19.3µg
0µg
16%
Vitamin B6
0.215mg
0.024mg
15%
Selenium
8.6µg
0.8µg
14%
Sodium
313mg
4mg
13%
Fiber
3.2g
0.2g
12%
Starch
28.33g
12%
Magnesium
42mg
2mg
10%
Vitamin B1
0.123mg
0mg
10%
Saturated fat
2.173g
0g
10%
Potassium
362mg
52mg
9%
Protein
4.32g
0.3g
8%
Vitamin B2
0.133mg
0.038mg
7%
Calcium
63mg
6mg
6%
Zinc
0.86mg
0.22mg
6%
Vitamin B5
0.38mg
0.068mg
6%
Manganese
0.187mg
0.08mg
5%
Iron
0.75mg
0.42mg
4%
Choline
26.4mg
2.2mg
4%
Copper
0.064mg
0.036mg
3%
Vitamin B3
0.63mg
0.121mg
3%
Vitamin B12
0.07µg
0µg
3%
Calories
343kcal
304kcal
2%
Folate
10µg
2µg
2%
Vitamin C
1.1mg
0.5mg
1%
Cholesterol
3mg
0mg
1%
Vitamin A
5µg
0µg
1%
Protein per 100 calories
1.3g
0.1g
N/A
Calories per 10 g protein
794kcal
10133kcal
N/A
Weight per 100 calories
29g
33g
N/A
Unsaturated / Saturated Fat ratio
8.8
N/A
Net carbs
31.71g
82.2g
N/A
Sugar
2.17g
82.12g
N/A
Trans fat
0.058g
N/A
Tryptophan
0.042mg
0.004mg
0%
Threonine
0.156mg
0.004mg
0%
Isoleucine
0.187mg
0.008mg
0%
Leucine
0.521mg
0.01mg
0%
Lysine
0.156mg
0.008mg
0%
Methionine
0.094mg
0.001mg
0%
Phenylalanine
0.229mg
0.011mg
0%
Valine
0.25mg
0.009mg
0%
Histidine
0.135mg
0.001mg
0%
Omega-3 - ALA
0.617g
N/A
Omega-6 - Gamma-linoleic acid
0.032g
N/A
Omega-6 - Eicosadienoic acid
0.011g
N/A
Omega-6 - Linoleic acid
4.343g
N/A
Macronutrient Comparison
Macronutrient breakdown side-by-side comparison
4
4%
22%
35%
37%
2%
Protein:
4.32 g
Fats:
21.5 g
Carbs:
34.91 g
Water:
37.4 g
Other:
1.87 g
1
82%
17%
Protein:
0.3 g
Fats:
0 g
Carbs:
82.4 g
Water:
17.1 g
Other:
0.2 g
Contains
more
Protein Protein
+1340%
Contains
more
Fats Fats
+∞%
Contains
more
Water Water
+118.7%
Contains
more
Other Other
+835%
Contains
more
Carbs Carbs
+136%
Carbohydrate type comparison
Carbohydrate type breakdown side-by-side comparison
2
93%
2%
5%
Starch:
28.33 g
Sucrose:
0.53 g
Glucose:
0 g
Fructose:
0 g
Lactose:
1.63 g
Maltose:
0 g
Galactose:
0 g
5
44%
50%
2%
4%
Starch:
0 g
Sucrose:
0.89 g
Glucose:
35.75 g
Fructose:
40.94 g
Lactose:
0 g
Maltose:
1.44 g
Galactose:
3.1 g
Contains
more
Starch Starch
+∞%
Contains
more
Lactose Lactose
+∞%
Contains
more
Sucrose Sucrose
+67.9%
Contains
more
Glucose Glucose
+∞%
Contains
more
Fructose Fructose
+∞%
Contains
more
Maltose Maltose
+∞%
Contains
more
Galactose Galactose
+∞%