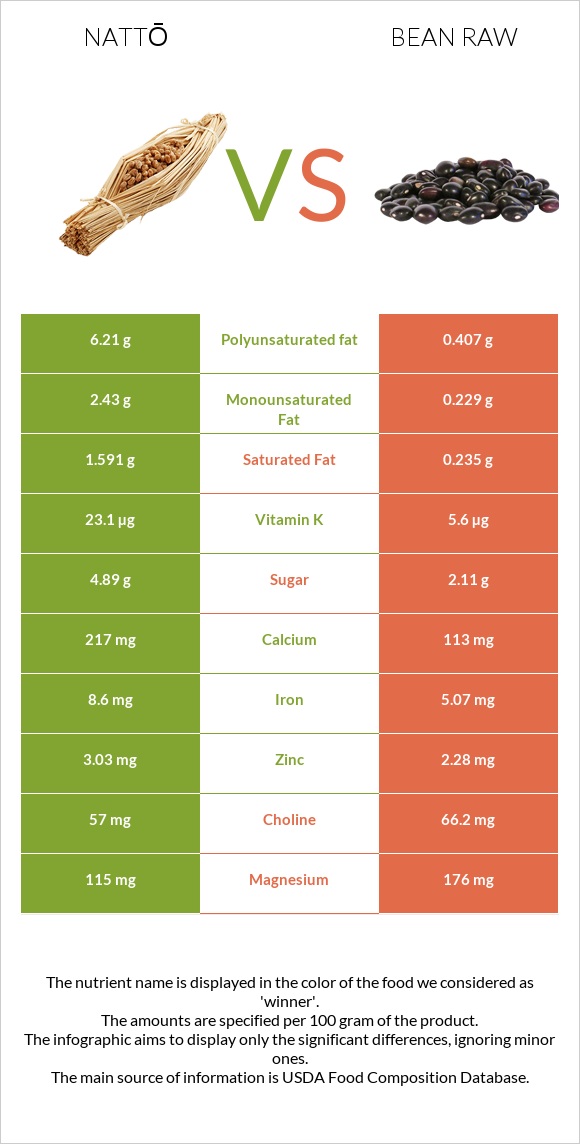
A recap on the differences between nattō and bean raw Nattō has more iron and manganese; however, bean raw is higher in folate, vitamin B1, fiber, selenium, phosphorus, vitamin B6, copper, and potassium. Bean raw covers your daily folate needs 129% more than nattō. Bean raw contains 2 times less iron than nattō. Nattō contains 8.6mg of iron, while bean raw contains 5.07mg. The glycemic index of nattō is higher. Food varieties used in this article are Natto and Beans, pinto, mature seeds, raw .
Infographic
Mineral Comparison
Mineral comparison score is based on the number of minerals by which one or the other food is richer. The "coverage" charts below show how much of the daily needs can be covered by 300 grams of the food.
5
100 g
300 g
1 cup - 175g
Magnesium
Magnesium
Calcium
Calcium
Potassium
Potassium
Iron
Iron
Copper
Copper
Zinc
Zinc
Phosphorus
Phosphorus
Sodium
Sodium
Manganese
Manganese
Selenium
Selenium
82%
65%
64%
323%
222%
83%
75%
0.91%
199%
48%
5
100 g
300 g
1 tbsp - 12g 1 cup - 193g
Magnesium
Magnesium
Calcium
Calcium
Potassium
Potassium
Iron
Iron
Copper
Copper
Zinc
Zinc
Phosphorus
Phosphorus
Sodium
Sodium
Manganese
Manganese
Selenium
Selenium
126%
34%
123%
190%
298%
62%
176%
1.6%
150%
152%
Vitamin Comparison
Vitamin comparison score is based on the number of vitamins by which one or the other food is richer. The "coverage" charts below show how much of the daily needs can be covered by 300 grams of the food.
2
100 g
300 g
1 cup - 175g
Vitamin C
Vit. C
Vitamin D
Vit. D
Vitamin A
Vit. A
Vitamin E
Vit. E
Vitamin B1
Vit. B1
Vitamin B2
Vit. B2
Vitamin B3
Vit. B3
Vitamin B5
Vit. B5
Vitamin B6
Vit. B6
Vitamin B12
Vit. B12
Vitamin K
Vit. K
Folate
Folate
43%
0%
0%
0.2%
40%
44%
0%
13%
30%
0%
58%
6%
7
100 g
300 g
1 tbsp - 12g 1 cup - 193g
Vitamin C
Vit. C
Vitamin D
Vit. D
Vitamin A
Vit. A
Vitamin E
Vit. E
Vitamin B1
Vit. B1
Vitamin B2
Vit. B2
Vitamin B3
Vit. B3
Vitamin B5
Vit. B5
Vitamin B6
Vit. B6
Vitamin B12
Vit. B12
Vitamin K
Vit. K
Folate
Folate
21%
0%
0%
4.2%
178%
49%
22%
47%
109%
0%
14%
394%
All nutrients comparison - raw data values
Nutrient
DV% diff.
Folate
8µg
525µg
129%
Vitamin B1
0.16mg
0.713mg
46%
Iron
8.6mg
5.07mg
44%
Fiber
5.4g
15.5g
40%
Polyunsaturated fat
6.21g
0.407g
39%
Selenium
8.8µg
27.9µg
35%
Phosphorus
174mg
411mg
34%
Vitamin B6
0.13mg
0.474mg
26%
Copper
0.667mg
0.893mg
25%
Potassium
729mg
1393mg
20%
Carbs
12.68g
62.55g
17%
Manganese
1.528mg
1.148mg
17%
Fats
11g
1.23g
15%
Magnesium
115mg
176mg
15%
Vitamin K
23.1µg
5.6µg
15%
Starch
34.17g
14%
Vitamin B5
0.215mg
0.785mg
11%
Calcium
217mg
113mg
10%
Calories
211kcal
347kcal
7%
Vitamin C
13mg
6.3mg
7%
Zinc
3.03mg
2.28mg
7%
Vitamin B3
0mg
1.174mg
7%
Saturated fat
1.591g
0.235g
6%
Monounsaturated fat
2.43g
0.229g
6%
Protein
19.4g
21.42g
4%
Vitamin B2
0.19mg
0.212mg
2%
Choline
57mg
66.2mg
2%
Vitamin E
0.01mg
0.21mg
1%
Protein per 100 calories
9.2g
6.2g
N/A
Calories per 10 g protein
109kcal
162kcal
N/A
Weight per 100 calories
47g
29g
N/A
Unsaturated / Saturated Fat ratio
5.4
2.7
N/A
Net carbs
7.28g
47.05g
N/A
Sugar
4.89g
2.11g
N/A
Sodium
7mg
12mg
0%
Tryptophan
0.223mg
0.237mg
0%
Threonine
0.813mg
0.81mg
0%
Isoleucine
0.931mg
0.871mg
0%
Leucine
1.509mg
1.558mg
0%
Lysine
1.145mg
1.356mg
0%
Methionine
0.208mg
0.259mg
0%
Phenylalanine
0.941mg
1.095mg
0%
Valine
1.018mg
0.998mg
0%
Histidine
0.512mg
0.556mg
0%
Macronutrient Comparison
Macronutrient breakdown side-by-side comparison
2
19%
11%
13%
55%
2%
Protein:
19.4 g
Fats:
11 g
Carbs:
12.68 g
Water:
55.02 g
Other:
1.9 g
3
21%
63%
11%
3%
Protein:
21.42 g
Fats:
1.23 g
Carbs:
62.55 g
Water:
11.33 g
Other:
3.47 g
Contains
more
Fats Fats
+794.3%
Contains
more
Water Water
+385.6%
Contains
more
Protein Protein
+10.4%
Contains
more
Carbs Carbs
+393.3%
Contains
more
Other Other
+82.6%
Fat Type Comparison
Fat type breakdown side-by-side comparison
2
16%
24%
61%
Saturated fat:
Sat. Fat
1.591 g
Monounsaturated fat:
Mono. Fat
2.43 g
Polyunsaturated fat:
Poly. Fat
6.21 g
1
27%
26%
47%
Saturated fat:
Sat. Fat
0.235 g
Monounsaturated fat:
Mono. Fat
0.229 g
Polyunsaturated fat:
Poly. Fat
0.407 g
Contains
more
Mono. Fat Monounsaturated fat
+961.1%
Contains
more
Poly. Fat Polyunsaturated fat
+1425.8%
Contains
less
Sat. Fat Saturated fat
-85.2%