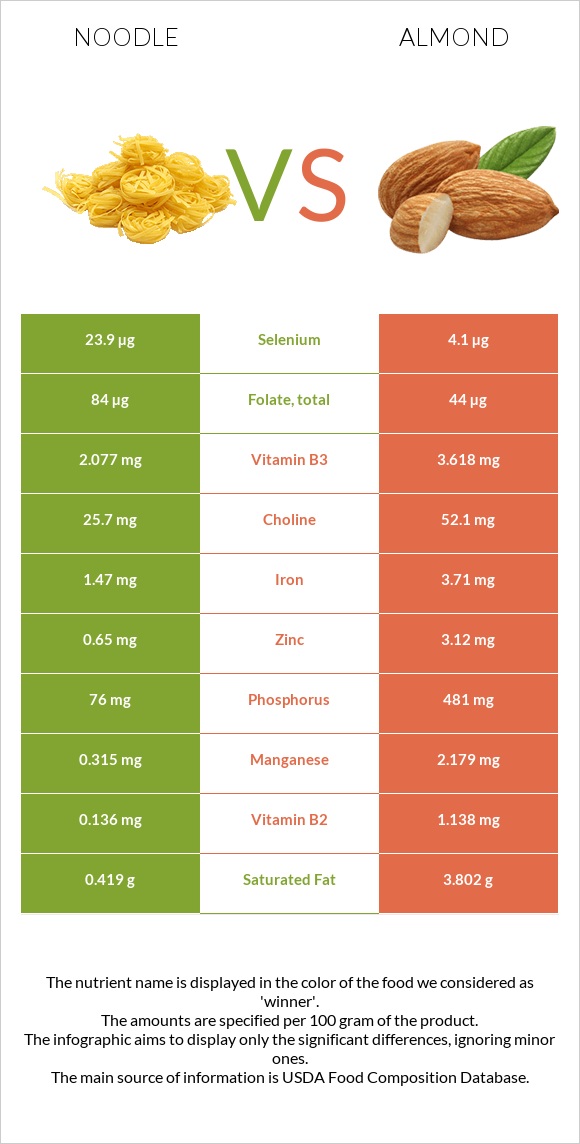
Differences between noodles and almonds Noodles is higher in selenium; however, almonds are richer in vitamin E, copper, manganese, vitamin B2, magnesium, phosphorus, fiber, iron, and calcium. Almonds' daily need coverage for vitamin E is 170% higher. Noodles has 6 times more selenium than almonds. While noodles has 23.9µg of selenium, almonds have only 4.1µg. Almonds have a lower glycemic index (0) than noodles (50). The food types used in this comparison are Noodles, egg, enriched, cooked and Nuts, almonds .
Infographic
Mineral Comparison
Mineral comparison score is based on the number of minerals by which one or the other food is richer. The "coverage" charts below show how much of the daily needs can be covered by 300 grams of the food.
1
100 g
300 g
1 cup - 160g
Magnesium
Magnesium
Calcium
Calcium
Potassium
Potassium
Iron
Iron
Copper
Copper
Zinc
Zinc
Phosphorus
Phosphorus
Sodium
Sodium
Manganese
Manganese
Selenium
Selenium
15%
3.6%
3.4%
55%
33%
18%
33%
0.65%
41%
130%
9
100 g
300 g
1 almond - 1.2g 1 oz (23 whole kernels) - 28.35g 1 cup, sliced - 92g 1 cup, ground - 95g 1 cup, slivered - 108g 1 cup, whole - 143g
Magnesium
Magnesium
Calcium
Calcium
Potassium
Potassium
Iron
Iron
Copper
Copper
Zinc
Zinc
Phosphorus
Phosphorus
Sodium
Sodium
Manganese
Manganese
Selenium
Selenium
193%
81%
65%
139%
344%
85%
206%
0.13%
284%
22%
Vitamin Comparison
Vitamin comparison score is based on the number of vitamins by which one or the other food is richer. The "coverage" charts below show how much of the daily needs can be covered by 300 grams of the food.
5
100 g
300 g
1 cup - 160g
Vitamin C
Vit. C
Vitamin D
Vit. D
Vitamin A
Vit. A
Vitamin E
Vit. E
Vitamin B1
Vit. B1
Vitamin B2
Vit. B2
Vitamin B3
Vit. B3
Vitamin B5
Vit. B5
Vitamin B6
Vit. B6
Vitamin B12
Vit. B12
Vitamin K
Vit. K
Folate
Folate
0%
1.5%
2%
3.4%
72%
31%
39%
16%
11%
11%
0%
63%
5
100 g
300 g
1 almond - 1.2g 1 oz (23 whole kernels) - 28.35g 1 cup, sliced - 92g 1 cup, ground - 95g 1 cup, slivered - 108g 1 cup, whole - 143g
Vitamin C
Vit. C
Vitamin D
Vit. D
Vitamin A
Vit. A
Vitamin E
Vit. E
Vitamin B1
Vit. B1
Vitamin B2
Vit. B2
Vitamin B3
Vit. B3
Vitamin B5
Vit. B5
Vitamin B6
Vit. B6
Vitamin B12
Vit. B12
Vitamin K
Vit. K
Folate
Folate
0%
0%
0%
513%
51%
263%
68%
28%
32%
0%
0%
33%
All nutrients comparison - raw data values
Nutrient
DV% diff.
Vitamin E
0.17mg
25.63mg
170%
Copper
0.098mg
1.031mg
104%
Manganese
0.315mg
2.179mg
81%
Polyunsaturated fat
0.552g
12.329g
79%
Vitamin B2
0.136mg
1.138mg
77%
Monounsaturated fat
0.581g
31.551g
77%
Fats
2.07g
49.93g
74%
Magnesium
21mg
270mg
59%
Phosphorus
76mg
481mg
58%
Fiber
1.2g
12.5g
45%
Selenium
23.9µg
4.1µg
36%
Protein
4.54g
21.15g
33%
Iron
1.47mg
3.71mg
28%
Calcium
12mg
269mg
26%
Calories
138kcal
579kcal
22%
Zinc
0.65mg
3.12mg
22%
Potassium
38mg
733mg
20%
Saturated fat
0.419g
3.802g
15%
Cholesterol
29mg
0mg
10%
Vitamin B3
2.077mg
3.618mg
10%
Folate
84µg
44µg
10%
Vitamin B1
0.289mg
0.205mg
7%
Vitamin B6
0.046mg
0.137mg
7%
Choline
25.7mg
52.1mg
5%
Vitamin B5
0.263mg
0.471mg
4%
Vitamin B12
0.09µg
0µg
4%
Carbs
25.16g
21.55g
1%
Vitamin D*
4 IU
0 IU
1%
Vitamin D
0.1µg
0µg
1%
Vitamin A
6µg
0µg
1%
Protein per 100 calories
3.3g
3.7g
N/A
Calories per 10 g protein
304kcal
274kcal
N/A
Weight per 100 calories
72g
17g
N/A
Unsaturated / Saturated Fat ratio
2.7
12
N/A
Net carbs
23.96g
9.05g
N/A
Sugar
0.4g
4.35g
N/A
Starch
0.72g
0%
Sodium
5mg
1mg
0%
Trans fat
0.029g
0.015g
N/A
Tryptophan
0.043mg
0.211mg
0%
Threonine
0.138mg
0.601mg
0%
Isoleucine
0.19mg
0.751mg
0%
Leucine
0.365mg
1.473mg
0%
Lysine
0.137mg
0.568mg
0%
Methionine
0.086mg
0.157mg
0%
Phenylalanine
0.24mg
1.132mg
0%
Valine
0.22mg
0.855mg
0%
Histidine
0.121mg
0.539mg
0%
Fructose
0g
0.11g
0%
Omega-3 - ALA
0.003g
N/A
Omega-6 - Eicosadienoic acid
0.002g
N/A
Omega-6 - Linoleic acid
12.32g
N/A
Macronutrient Comparison
Macronutrient breakdown side-by-side comparison
2
5%
2%
25%
68%
Protein:
4.54 g
Fats:
2.07 g
Carbs:
25.16 g
Water:
67.73 g
Other:
0.5 g
3
21%
50%
22%
4%
3%
Protein:
21.15 g
Fats:
49.93 g
Carbs:
21.55 g
Water:
4.41 g
Other:
2.96 g
Contains
more
Carbs Carbs
+16.8%
Contains
more
Water Water
+1435.8%
Contains
more
Protein Protein
+365.9%
Contains
more
Fats Fats
+2312.1%
Contains
more
Other Other
+492%
Fat Type Comparison
Fat type breakdown side-by-side comparison
1
27%
37%
36%
Saturated fat:
Sat. Fat
0.419 g
Monounsaturated fat:
Mono. Fat
0.581 g
Polyunsaturated fat:
Poly. Fat
0.552 g
2
8%
66%
26%
Saturated fat:
Sat. Fat
3.802 g
Monounsaturated fat:
Mono. Fat
31.551 g
Polyunsaturated fat:
Poly. Fat
12.329 g
Contains
less
Sat. Fat Saturated fat
-89%
Contains
more
Mono. Fat Monounsaturated fat
+5330.5%
Contains
more
Poly. Fat Polyunsaturated fat
+2133.5%
Carbohydrate type comparison
Carbohydrate type breakdown side-by-side comparison
1
10%
17%
73%
Starch:
0 g
Sucrose:
0.04 g
Glucose:
0.07 g
Fructose:
0 g
Lactose:
0 g
Maltose:
0.3 g
Galactose:
0 g
5
14%
78%
3%
2%
Starch:
0.72 g
Sucrose:
3.95 g
Glucose:
0.17 g
Fructose:
0.11 g
Lactose:
0 g
Maltose:
0.04 g
Galactose:
0.07 g
Contains
more
Maltose Maltose
+650%
Contains
more
Starch Starch
+∞%
Contains
more
Sucrose Sucrose
+9775%
Contains
more
Glucose Glucose
+142.9%
Contains
more
Fructose Fructose
+∞%
Contains
more
Galactose Galactose
+∞%