A recap on the differences between pistachios and cumin Pistachios have more vitamin B6 and copper; however, cumin is higher in iron, manganese, calcium, magnesium, zinc, potassium, and vitamin B3. Cumin covers your daily iron needs 781% more than pistachios. Cumin contains 4 times less vitamin B6 than pistachios. Pistachios contain 1.7mg of vitamin B6, while cumin contains 0.435mg. Cumin has less saturated fat. The glycemic index of pistachios is higher. Food varieties used in this article are Nuts, pistachio nuts, raw and Spices, cumin seed .
Infographic
Mineral Comparison
Mineral comparison score is based on the number of minerals by which one or the other food is richer. The "coverage" charts below show how much of the daily needs can be covered by 300 grams of the food.
3
100 g
300 g
1 kernel - 0.7g 1 oz (49 kernels) - 28.35g 1 cup - 123g
Magnesium
Magnesium
Calcium
Calcium
Potassium
Potassium
Iron
Iron
Copper
Copper
Zinc
Zinc
Phosphorus
Phosphorus
Sodium
Sodium
Manganese
Manganese
Selenium
Selenium
86%
32%
90%
147%
433%
60%
210%
0.13%
157%
38%
6
100 g
300 g
0.25 tsp, whole - 0.5g 1 tbsp, whole - 6g
Magnesium
Magnesium
Calcium
Calcium
Potassium
Potassium
Iron
Iron
Copper
Copper
Zinc
Zinc
Phosphorus
Phosphorus
Sodium
Sodium
Manganese
Manganese
Selenium
Selenium
261%
279%
158%
2489%
289%
131%
214%
22%
435%
28%
Vitamin Comparison
Vitamin comparison score is based on the number of vitamins by which one or the other food is richer. The "coverage" charts below show how much of the daily needs can be covered by 300 grams of the food.
4
100 g
300 g
1 kernel - 0.7g 1 oz (49 kernels) - 28.35g 1 cup - 123g
Vitamin C
Vit. C
Vitamin D
Vit. D
Vitamin A
Vit. A
Vitamin E
Vit. E
Vitamin B1
Vit. B1
Vitamin B2
Vit. B2
Vitamin B3
Vit. B3
Vitamin B5
Vit. B5
Vitamin B6
Vit. B6
Vitamin B12
Vit. B12
Vitamin K
Vit. K
Folate
Folate
19%
0%
8.7%
57%
218%
37%
24%
31%
392%
0%
0%
38%
6
100 g
300 g
0.25 tsp, whole - 0.5g 1 tbsp, whole - 6g
Vitamin C
Vit. C
Vitamin D
Vit. D
Vitamin A
Vit. A
Vitamin E
Vit. E
Vitamin B1
Vit. B1
Vitamin B2
Vit. B2
Vitamin B3
Vit. B3
Vitamin B5
Vit. B5
Vitamin B6
Vit. B6
Vitamin B12
Vit. B12
Vitamin K
Vit. K
Folate
Folate
26%
0%
21%
67%
157%
75%
86%
0%
100%
0%
14%
7.5%
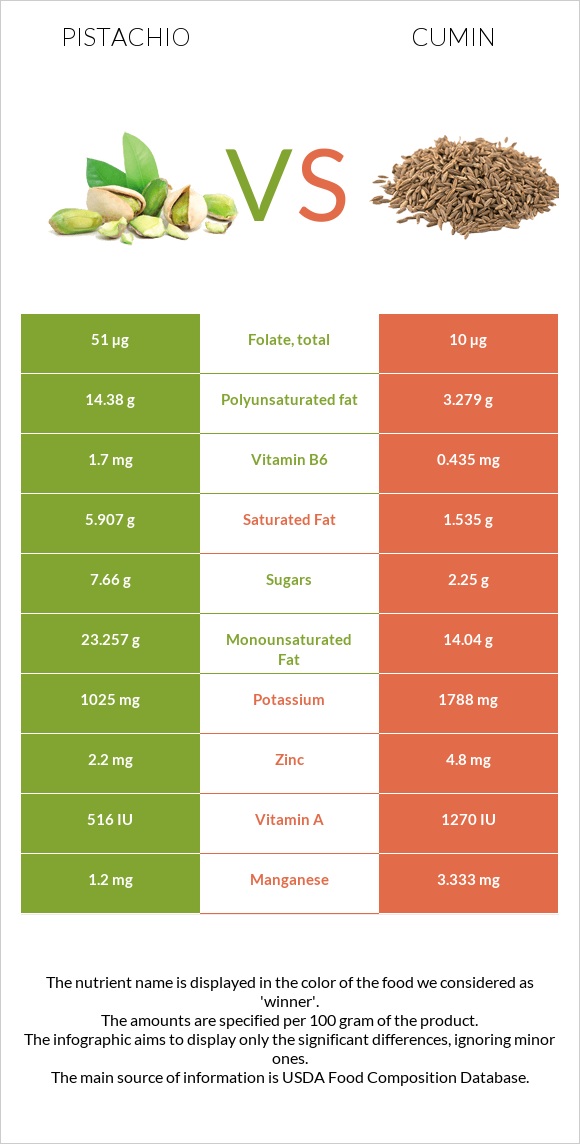
All nutrients comparison - raw data values
Nutrient
DV% diff.
Iron
3.92mg
66.36mg
781%
Vitamin B6
1.7mg
0.435mg
97%
Manganese
1.2mg
3.333mg
93%
Calcium
105mg
931mg
83%
Polyunsaturated fat
14.38g
3.279g
74%
Magnesium
121mg
366mg
58%
Copper
1.3mg
0.867mg
48%
Fats
45.32g
22.27g
35%
Zinc
2.2mg
4.8mg
24%
Monounsaturated fat
23.257g
14.04g
23%
Potassium
1025mg
1788mg
22%
Vitamin B1
0.87mg
0.628mg
20%
Vitamin B3
1.3mg
4.579mg
20%
Saturated fat
5.907g
1.535g
20%
Vitamin B2
0.16mg
0.327mg
13%
Vitamin B5
0.52mg
10%
Folate
51µg
10µg
10%
Calories
560kcal
375kcal
9%
Sodium
1mg
168mg
7%
Carbs
27.17g
44.24g
6%
Protein
20.16g
17.81g
5%
Vitamin K
5.4µg
5%
Vitamin A
26µg
64µg
4%
Choline
24.7mg
4%
Vitamin E
2.86mg
3.33mg
3%
Selenium
7µg
5.2µg
3%
Vitamin C
5.6mg
7.7mg
2%
Starch
1.67g
1%
Phosphorus
490mg
499mg
1%
Protein per 100 calories
3.6g
4.7g
N/A
Calories per 10 g protein
278kcal
211kcal
N/A
Weight per 100 calories
18g
27g
N/A
Unsaturated / Saturated Fat ratio
6.4
11
N/A
Net carbs
16.57g
33.74g
N/A
Sugar
7.66g
2.25g
N/A
Fiber
10.6g
10.5g
0%
Tryptophan
0.251mg
0%
Threonine
0.684mg
0%
Isoleucine
0.917mg
0%
Leucine
1.604mg
0%
Lysine
1.138mg
0%
Methionine
0.36mg
0%
Phenylalanine
1.092mg
0%
Valine
1.249mg
0%
Histidine
0.512mg
0%
Fructose
0.24g
0%
Omega-6 - Linoleic acid
14.091g
N/A
Macronutrient Comparison
Macronutrient breakdown side-by-side comparison
2
20%
45%
27%
4%
3%
Protein:
20.16 g
Fats:
45.32 g
Carbs:
27.17 g
Water:
4.37 g
Other:
2.98 g
3
18%
22%
44%
8%
8%
Protein:
17.81 g
Fats:
22.27 g
Carbs:
44.24 g
Water:
8.06 g
Other:
7.62 g
Contains
more
Protein Protein
+13.2%
Contains
more
Fats Fats
+103.5%
Contains
more
Carbs Carbs
+62.8%
Contains
more
Water Water
+84.4%
Contains
more
Other Other
+155.7%
Fat Type Comparison
Fat type breakdown side-by-side comparison
2
14%
53%
33%
Saturated fat:
Sat. Fat
5.907 g
Monounsaturated fat:
Mono. Fat
23.257 g
Polyunsaturated fat:
Poly. Fat
14.38 g
1
8%
74%
17%
Saturated fat:
Sat. Fat
1.535 g
Monounsaturated fat:
Mono. Fat
14.04 g
Polyunsaturated fat:
Poly. Fat
3.279 g
Contains
more
Mono. Fat Monounsaturated fat
+65.6%
Contains
more
Poly. Fat Polyunsaturated fat
+338.5%
Contains
less
Sat. Fat Saturated fat
-74%