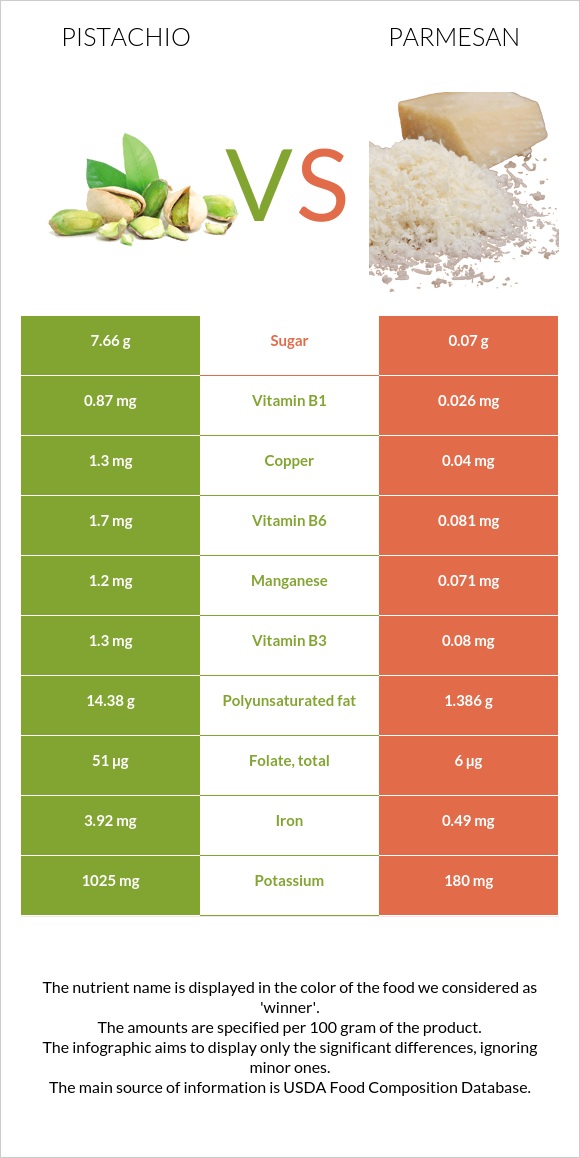
Summary of differences between pistachios and parmesan Pistachios have more copper, vitamin B6, vitamin B1, manganese, and iron, while parmesan has more calcium, vitamin B12, and selenium. Pistachios cover your daily need for copper, 140% more than parmesan. Pistachios contain 33 times more vitamin B1 than parmesan. While pistachios contain 0.87mg of vitamin B1, parmesan contains only 0.026mg. The amount of saturated fat in pistachios is lower. These are the specific foods used in this comparison Nuts, pistachio nuts, raw and Cheese, parmesan, grated .
Infographic
Mineral Comparison
Mineral comparison score is based on the number of minerals by which one or the other food is richer. The "coverage" charts below show how much of the daily needs can be covered by 300 grams of the food.
6
100 g
300 g
1 kernel - 0.7g 1 oz (49 kernels) - 28.35g 1 cup - 123g
Magnesium
Magnesium
Calcium
Calcium
Potassium
Potassium
Iron
Iron
Copper
Copper
Zinc
Zinc
Phosphorus
Phosphorus
Sodium
Sodium
Manganese
Manganese
Selenium
Selenium
86%
32%
90%
147%
433%
60%
210%
0.13%
157%
38%
4
100 g
300 g
1 tbsp - 5g 1 oz - 28.35g
Magnesium
Magnesium
Calcium
Calcium
Potassium
Potassium
Iron
Iron
Copper
Copper
Zinc
Zinc
Phosphorus
Phosphorus
Sodium
Sodium
Manganese
Manganese
Selenium
Selenium
24%
256%
16%
18%
13%
115%
269%
235%
9.3%
188%
Vitamin Comparison
Vitamin comparison score is based on the number of vitamins by which one or the other food is richer. The "coverage" charts below show how much of the daily needs can be covered by 300 grams of the food.
7
100 g
300 g
1 kernel - 0.7g 1 oz (49 kernels) - 28.35g 1 cup - 123g
Vitamin C
Vit. C
Vitamin D
Vit. D
Vitamin A
Vit. A
Vitamin E
Vit. E
Vitamin B1
Vit. B1
Vitamin B2
Vit. B2
Vitamin B3
Vit. B3
Vitamin B5
Vit. B5
Vitamin B6
Vit. B6
Vitamin B12
Vit. B12
Vitamin K
Vit. K
Folate
Folate
19%
0%
8.7%
57%
218%
37%
24%
31%
392%
0%
0%
38%
5
100 g
300 g
1 tbsp - 5g 1 oz - 28.35g
Vitamin C
Vit. C
Vitamin D
Vit. D
Vitamin A
Vit. A
Vitamin E
Vit. E
Vitamin B1
Vit. B1
Vitamin B2
Vit. B2
Vitamin B3
Vit. B3
Vitamin B5
Vit. B5
Vitamin B6
Vit. B6
Vitamin B12
Vit. B12
Vitamin K
Vit. K
Folate
Folate
0%
7.5%
87%
11%
6.5%
83%
1.5%
27%
19%
175%
4.3%
4.5%
All nutrients comparison - raw data values
Nutrient
DV% diff.
Copper
1.3mg
0.04mg
140%
Vitamin B6
1.7mg
0.081mg
125%
Polyunsaturated fat
14.38g
1.386g
87%
Sodium
1mg
1804mg
78%
Calcium
105mg
853mg
75%
Vitamin B1
0.87mg
0.026mg
70%
Vitamin B12
0µg
1.4µg
58%
Selenium
7µg
34.4µg
50%
Manganese
1.2mg
0.071mg
49%
Iron
3.92mg
0.49mg
43%
Saturated fat
5.907g
15.371g
43%
Fiber
10.6g
0g
42%
Monounsaturated fat
23.257g
7.13g
40%
Cholesterol
0mg
86mg
29%
Fats
45.32g
27.84g
27%
Vitamin A
26µg
262µg
26%
Potassium
1025mg
180mg
25%
Magnesium
121mg
34mg
21%
Phosphorus
490mg
627mg
20%
Zinc
2.2mg
4.2mg
18%
Protein
20.16g
28.42g
17%
Vitamin E
2.86mg
0.53mg
16%
Vitamin B2
0.16mg
0.358mg
15%
Folate
51µg
6µg
11%
Vitamin B3
1.3mg
0.08mg
8%
Calories
560kcal
420kcal
7%
Vitamin C
5.6mg
0mg
6%
Carbs
27.17g
13.91g
4%
Vitamin D*
0 IU
21 IU
3%
Vitamin D
0µg
0.5µg
3%
Choline
14.1mg
3%
Starch
1.67g
1%
Vitamin B5
0.52mg
0.45mg
1%
Vitamin K
1.7µg
1%
Protein per 100 calories
3.6g
6.8g
N/A
Calories per 10 g protein
278kcal
148kcal
N/A
Weight per 100 calories
18g
24g
N/A
Unsaturated / Saturated Fat ratio
6.4
0.55
N/A
Net carbs
16.57g
13.91g
N/A
Sugar
7.66g
0.07g
N/A
Trans fat
0g
0.876g
N/A
Tryptophan
0.251mg
0.383mg
0%
Threonine
0.684mg
1.075mg
0%
Isoleucine
0.917mg
1.455mg
0%
Leucine
1.604mg
2.747mg
0%
Lysine
1.138mg
2.201mg
0%
Methionine
0.36mg
0.751mg
0%
Phenylalanine
1.092mg
1.538mg
0%
Valine
1.249mg
1.865mg
0%
Histidine
0.512mg
0.806mg
0%
Fructose
0.24g
0g
0%
Omega-3 - ALA
0.102g
N/A
Omega-3 - DPA
0g
0.015g
N/A
Omega-3 - Eicosatrienoic acid
0.002g
N/A
Omega-6 - Gamma-linoleic acid
0.002g
N/A
Omega-6 - Dihomo-gamma-linoleic acid
0.026g
N/A
Omega-6 - Eicosadienoic acid
0g
0.006g
N/A
Omega-6 - Linoleic acid
14.091g
0.87g
N/A
Macronutrient Comparison
Macronutrient breakdown side-by-side comparison
2
20%
45%
27%
4%
3%
Protein:
20.16 g
Fats:
45.32 g
Carbs:
27.17 g
Water:
4.37 g
Other:
2.98 g
3
28%
28%
14%
23%
7%
Protein:
28.42 g
Fats:
27.84 g
Carbs:
13.91 g
Water:
22.65 g
Other:
7.18 g
Contains
more
Fats Fats
+62.8%
Contains
more
Carbs Carbs
+95.3%
Contains
more
Protein Protein
+41%
Contains
more
Water Water
+418.3%
Contains
more
Other Other
+140.9%
Fat Type Comparison
Fat type breakdown side-by-side comparison
3
14%
53%
33%
Saturated fat:
Sat. Fat
5.907 g
Monounsaturated fat:
Mono. Fat
23.257 g
Polyunsaturated fat:
Poly. Fat
14.38 g
0
64%
30%
6%
Saturated fat:
Sat. Fat
15.371 g
Monounsaturated fat:
Mono. Fat
7.13 g
Polyunsaturated fat:
Poly. Fat
1.386 g
Contains
less
Sat. Fat Saturated fat
-61.6%
Contains
more
Mono. Fat Monounsaturated fat
+226.2%
Contains
more
Poly. Fat Polyunsaturated fat
+937.5%
Carbohydrate type comparison
Carbohydrate type breakdown side-by-side comparison
5
18%
74%
3%
3%
2%
Starch:
1.67 g
Sucrose:
6.87 g
Glucose:
0.32 g
Fructose:
0.24 g
Lactose:
0 g
Maltose:
0.17 g
Galactose:
0 g
1
100%
Starch:
0 g
Sucrose:
0 g
Glucose:
0 g
Fructose:
0 g
Lactose:
0 g
Maltose:
0 g
Galactose:
0.07 g
Contains
more
Starch Starch
+∞%
Contains
more
Sucrose Sucrose
+∞%
Contains
more
Glucose Glucose
+∞%
Contains
more
Fructose Fructose
+∞%
Contains
more
Maltose Maltose
+∞%
Contains
more
Galactose Galactose
+∞%