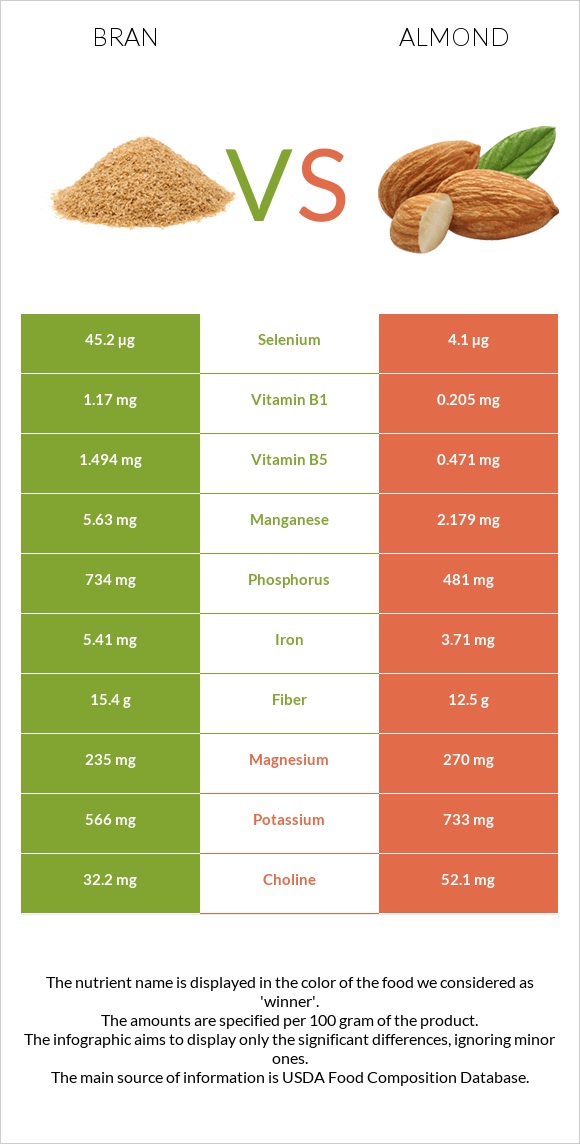
A recap on the differences between bran and almonds Bran has less copper, vitamin B2, magnesium, manganese, phosphorus, fiber, iron, calcium, zinc, and vitamin B3. Almonds cover your daily copper needs 107% more than bran. The glycemic index of bran is higher. Food varieties used in this article are Oat bran, cooked and Nuts, almonds .
Infographic
Mineral Comparison
Mineral comparison score is based on the number of minerals by which one or the other food is richer. The "coverage" charts below show how much of the daily needs can be covered by 300 grams of the food.
1
100 g
300 g
1 cup - 219g
Magnesium
Magnesium
Calcium
Calcium
Potassium
Potassium
Iron
Iron
Copper
Copper
Zinc
Zinc
Phosphorus
Phosphorus
Sodium
Sodium
Manganese
Manganese
Selenium
Selenium
29%
3%
8.1%
33%
22%
14%
51%
0.13%
126%
42%
8
100 g
300 g
1 almond - 1.2g 1 oz (23 whole kernels) - 28.35g 1 cup, sliced - 92g 1 cup, ground - 95g 1 cup, slivered - 108g 1 cup, whole - 143g
Magnesium
Magnesium
Calcium
Calcium
Potassium
Potassium
Iron
Iron
Copper
Copper
Zinc
Zinc
Phosphorus
Phosphorus
Sodium
Sodium
Manganese
Manganese
Selenium
Selenium
193%
81%
65%
139%
344%
85%
206%
0.13%
284%
22%
Vitamin Comparison
Vitamin comparison score is based on the number of vitamins by which one or the other food is richer. The "coverage" charts below show how much of the daily needs can be covered by 300 grams of the food.
0
100 g
300 g
1 cup - 219g
Vitamin C
Vit. C
Vitamin D
Vit. D
Vitamin A
Vit. A
Vitamin E
Vit. E
Vitamin B1
Vit. B1
Vitamin B2
Vit. B2
Vitamin B3
Vit. B3
Vitamin B5
Vit. B5
Vitamin B6
Vit. B6
Vitamin B12
Vit. B12
Vitamin K
Vit. K
Folate
Folate
0%
0%
0%
0%
40%
7.8%
2.7%
13%
5.8%
0%
0%
4.5%
7
100 g
300 g
1 almond - 1.2g 1 oz (23 whole kernels) - 28.35g 1 cup, sliced - 92g 1 cup, ground - 95g 1 cup, slivered - 108g 1 cup, whole - 143g
Vitamin C
Vit. C
Vitamin D
Vit. D
Vitamin A
Vit. A
Vitamin E
Vit. E
Vitamin B1
Vit. B1
Vitamin B2
Vit. B2
Vitamin B3
Vit. B3
Vitamin B5
Vit. B5
Vitamin B6
Vit. B6
Vitamin B12
Vit. B12
Vitamin K
Vit. K
Folate
Folate
0%
0%
0%
513%
51%
263%
68%
28%
32%
0%
0%
33%
All nutrients comparison - raw data values
Nutrient
DV% diff.
Vitamin E
25.63mg
171%
Copper
0.066mg
1.031mg
107%
Vitamin B2
0.034mg
1.138mg
85%
Polyunsaturated fat
0.339g
12.329g
80%
Monounsaturated fat
0.291g
31.551g
78%
Fats
0.86g
49.93g
75%
Magnesium
40mg
270mg
55%
Manganese
0.964mg
2.179mg
53%
Phosphorus
119mg
481mg
52%
Fiber
2.6g
12.5g
40%
Protein
3.21g
21.15g
36%
Iron
0.88mg
3.71mg
35%
Calories
40kcal
579kcal
27%
Calcium
10mg
269mg
26%
Zinc
0.53mg
3.12mg
24%
Vitamin B3
0.144mg
3.618mg
22%
Potassium
92mg
733mg
19%
Saturated fat
0.163g
3.802g
17%
Folate
6µg
44µg
10%
Vitamin B6
0.025mg
0.137mg
9%
Choline
52.1mg
9%
Selenium
7.7µg
4.1µg
7%
Vitamin B5
0.217mg
0.471mg
5%
Vitamin B1
0.16mg
0.205mg
4%
Carbs
11.44g
21.55g
3%
Protein per 100 calories
8g
3.7g
N/A
Calories per 10 g protein
125kcal
274kcal
N/A
Weight per 100 calories
250g
17g
N/A
Unsaturated / Saturated Fat ratio
3.9
12
N/A
Net carbs
8.84g
9.05g
N/A
Sugar
4.35g
N/A
Starch
0.72g
0%
Sodium
1mg
1mg
0%
Trans fat
0.015g
N/A
Tryptophan
0.057mg
0.211mg
0%
Threonine
0.086mg
0.601mg
0%
Isoleucine
0.114mg
0.751mg
0%
Leucine
0.235mg
1.473mg
0%
Lysine
0.13mg
0.568mg
0%
Methionine
0.057mg
0.157mg
0%
Phenylalanine
0.155mg
1.132mg
0%
Valine
0.165mg
0.855mg
0%
Histidine
0.07mg
0.539mg
0%
Fructose
0.11g
0%
Omega-3 - ALA
0.003g
N/A
Omega-6 - Eicosadienoic acid
0.002g
N/A
Omega-6 - Linoleic acid
12.32g
N/A
Macronutrient Comparison
Macronutrient breakdown side-by-side comparison
1
3%
11%
84%
Protein:
3.21 g
Fats:
0.86 g
Carbs:
11.44 g
Water:
84 g
Other:
0.49 g
4
21%
50%
22%
4%
3%
Protein:
21.15 g
Fats:
49.93 g
Carbs:
21.55 g
Water:
4.41 g
Other:
2.96 g
Contains
more
Water Water
+1804.8%
Contains
more
Protein Protein
+558.9%
Contains
more
Fats Fats
+5705.8%
Contains
more
Carbs Carbs
+88.4%
Contains
more
Other Other
+504.1%
Fat Type Comparison
Fat type breakdown side-by-side comparison
1
21%
37%
43%
Saturated fat:
Sat. Fat
0.163 g
Monounsaturated fat:
Mono. Fat
0.291 g
Polyunsaturated fat:
Poly. Fat
0.339 g
2
8%
66%
26%
Saturated fat:
Sat. Fat
3.802 g
Monounsaturated fat:
Mono. Fat
31.551 g
Polyunsaturated fat:
Poly. Fat
12.329 g
Contains
less
Sat. Fat Saturated fat
-95.7%
Contains
more
Mono. Fat Monounsaturated fat
+10742.3%
Contains
more
Poly. Fat Polyunsaturated fat
+3536.9%