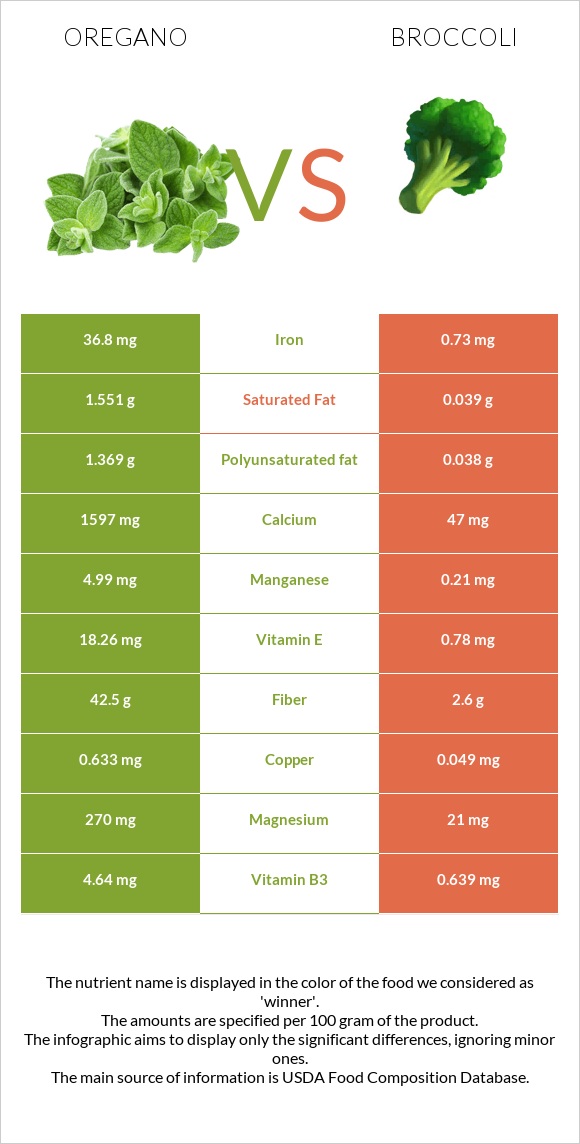
What are the differences between oregano and broccoli? Oregano is higher in iron, vitamin K, manganese, fiber, calcium, vitamin E, vitamin B6, copper, and magnesium, yet broccoli is higher in vitamin C. Oregano's daily need coverage for iron is 451% more. Oregano has 34 times more calcium than broccoli. While oregano has 1597mg of calcium, broccoli has only 47mg. The glycemic index of oregano is lower. We used Spices, oregano, dried and Broccoli, raw types in this article.
Infographic
Mineral Comparison
Mineral comparison score is based on the number of minerals by which one or the other food is richer. The "coverage" charts below show how much of the daily needs can be covered by 300 grams of the food.
10
100 g
300 g
0.25 tsp - 0.5g 1 tsp, ground - 1.8g
Magnesium
Magnesium
Calcium
Calcium
Potassium
Potassium
Iron
Iron
Copper
Copper
Zinc
Zinc
Phosphorus
Phosphorus
Sodium
Sodium
Manganese
Manganese
Selenium
Selenium
193%
479%
111%
1380%
211%
73%
63%
3.3%
651%
25%
0
100 g
300 g
1 spear (about 5" long) - 31g 0.5 cup, chopped or diced - 44g 1 cup chopped - 91g 1 NLEA serving - 148g 1 stalk - 151g 1 bunch - 608g
Magnesium
Magnesium
Calcium
Calcium
Potassium
Potassium
Iron
Iron
Copper
Copper
Zinc
Zinc
Phosphorus
Phosphorus
Sodium
Sodium
Manganese
Manganese
Selenium
Selenium
15%
14%
28%
27%
16%
11%
28%
4.3%
27%
14%
Vitamin Comparison
Vitamin comparison score is based on the number of vitamins by which one or the other food is richer. The "coverage" charts below show how much of the daily needs can be covered by 300 grams of the food.
9
100 g
300 g
0.25 tsp - 0.5g 1 tsp, ground - 1.8g
Vitamin C
Vit. C
Vitamin D
Vit. D
Vitamin A
Vit. A
Vitamin E
Vit. E
Vitamin B1
Vit. B1
Vitamin B2
Vit. B2
Vitamin B3
Vit. B3
Vitamin B5
Vit. B5
Vitamin B6
Vit. B6
Vitamin B12
Vit. B12
Vitamin K
Vit. K
Folate
Folate
7.7%
0%
28%
365%
44%
122%
87%
55%
241%
0%
1554%
178%
1
100 g
300 g
1 spear (about 5" long) - 31g 0.5 cup, chopped or diced - 44g 1 cup chopped - 91g 1 NLEA serving - 148g 1 stalk - 151g 1 bunch - 608g
Vitamin C
Vit. C
Vitamin D
Vit. D
Vitamin A
Vit. A
Vitamin E
Vit. E
Vitamin B1
Vit. B1
Vitamin B2
Vit. B2
Vitamin B3
Vit. B3
Vitamin B5
Vit. B5
Vitamin B6
Vit. B6
Vitamin B12
Vit. B12
Vitamin K
Vit. K
Folate
Folate
297%
0%
10%
16%
18%
27%
12%
34%
40%
0%
254%
47%
All nutrients comparison - raw data values
Nutrient
DV% diff.
Iron
36.8mg
0.73mg
451%
Vitamin K
621.7µg
101.6µg
433%
Manganese
4.99mg
0.21mg
208%
Fiber
42.5g
2.6g
160%
Calcium
1597mg
47mg
155%
Vitamin E
18.26mg
0.78mg
117%
Vitamin C
2.3mg
89.2mg
97%
Vitamin B6
1.044mg
0.175mg
67%
Copper
0.633mg
0.049mg
65%
Magnesium
270mg
21mg
59%
Folate
237µg
63µg
44%
Vitamin B2
0.528mg
0.117mg
32%
Potassium
1260mg
316mg
28%
Vitamin B3
4.64mg
0.639mg
25%
Carbs
68.92g
6.64g
21%
Zinc
2.69mg
0.41mg
21%
Calories
265kcal
34kcal
12%
Protein
9g
2.82g
12%
Phosphorus
148mg
66mg
12%
Vitamin B1
0.177mg
0.071mg
9%
Polyunsaturated fat
1.369g
0.038g
9%
Vitamin B5
0.921mg
0.573mg
7%
Saturated fat
1.551g
0.039g
7%
Fats
4.28g
0.37g
6%
Vitamin A
85µg
31µg
6%
Selenium
4.5µg
2.5µg
4%
Choline
32.3mg
18.7mg
2%
Monounsaturated fat
0.716g
0.011g
2%
Fructose
1.13g
0.68g
1%
Protein per 100 calories
3.4g
8.3g
N/A
Calories per 10 g protein
294kcal
121kcal
N/A
Weight per 100 calories
38g
294g
N/A
Unsaturated / Saturated Fat ratio
1.3
1.3
N/A
Net carbs
26.42g
4.04g
N/A
Sugar
4.09g
1.7g
N/A
Sodium
25mg
33mg
0%
Tryptophan
0.203mg
0.033mg
0%
Threonine
0.322mg
0.088mg
0%
Isoleucine
0.441mg
0.079mg
0%
Leucine
0.78mg
0.129mg
0%
Lysine
0.5mg
0.135mg
0%
Methionine
0.127mg
0.038mg
0%
Phenylalanine
0.449mg
0.117mg
0%
Valine
0.585mg
0.125mg
0%
Histidine
0.144mg
0.059mg
0%
Omega-3 - ALA
0.621g
N/A
Macronutrient Comparison
Macronutrient breakdown side-by-side comparison
4
9%
4%
69%
10%
8%
Protein:
9 g
Fats:
4.28 g
Carbs:
68.92 g
Water:
9.93 g
Other:
7.87 g
1
3%
7%
89%
Protein:
2.82 g
Fats:
0.37 g
Carbs:
6.64 g
Water:
89.3 g
Other:
0.87 g
Contains
more
Protein Protein
+219.1%
Contains
more
Fats Fats
+1056.8%
Contains
more
Carbs Carbs
+938%
Contains
more
Other Other
+804.6%
Contains
more
Water Water
+799.3%
Fat Type Comparison
Fat type breakdown side-by-side comparison
2
43%
20%
38%
Saturated fat:
Sat. Fat
1.551 g
Monounsaturated fat:
Mono. Fat
0.716 g
Polyunsaturated fat:
Poly. Fat
1.369 g
1
44%
13%
43%
Saturated fat:
Sat. Fat
0.039 g
Monounsaturated fat:
Mono. Fat
0.011 g
Polyunsaturated fat:
Poly. Fat
0.038 g
Contains
more
Mono. Fat Monounsaturated fat
+6409.1%
Contains
more
Poly. Fat Polyunsaturated fat
+3502.6%
Contains
less
Sat. Fat Saturated fat
-97.5%
Carbohydrate type comparison
Carbohydrate type breakdown side-by-side comparison
4
22%
46%
28%
4%
Starch:
0 g
Sucrose:
0.91 g
Glucose:
1.9 g
Fructose:
1.13 g
Lactose:
0 g
Maltose:
0 g
Galactose:
0.15 g
2
6%
29%
40%
12%
12%
Starch:
0 g
Sucrose:
0.1 g
Glucose:
0.49 g
Fructose:
0.68 g
Lactose:
0.21 g
Maltose:
0.21 g
Galactose:
0 g
Contains
more
Sucrose Sucrose
+810%
Contains
more
Glucose Glucose
+287.8%
Contains
more
Fructose Fructose
+66.2%
Contains
more
Galactose Galactose
+∞%
Contains
more
Lactose Lactose
+∞%
Contains
more
Maltose Maltose
+∞%