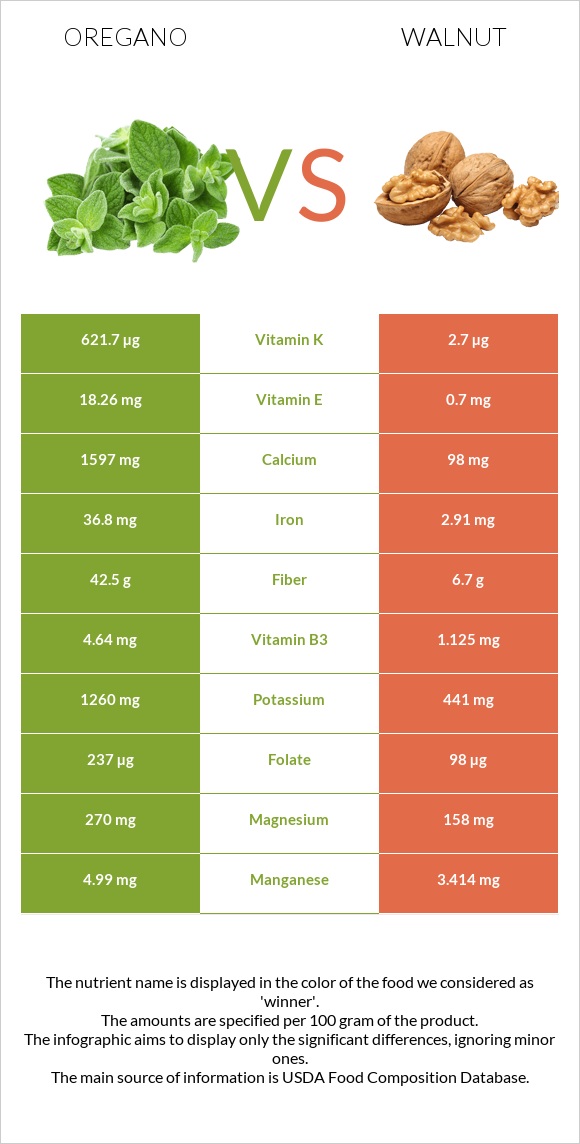
Important differences between oregano and walnut Oregano has more vitamin K, iron, calcium, fiber, vitamin E, manganese, vitamin B6, folate, and vitamin A; however, walnut has more copper. Oregano's daily need coverage for vitamin K is 516% more. Oregano has 85 times more vitamin A than walnut. Oregano has 1701 IU of vitamin A, while walnut has 20 IU. The food varieties used in the comparison are Spices, oregano, dried and Nuts, walnuts, english .
Infographic
Mineral Comparison
Mineral comparison score is based on the number of minerals by which one or the other food is richer. The "coverage" charts below show how much of the daily needs can be covered by 300 grams of the food.
5
100 g
300 g
0.25 tsp - 0.5g 1 tsp, ground - 1.8g
Magnesium
Magnesium
Calcium
Calcium
Potassium
Potassium
Iron
Iron
Copper
Copper
Zinc
Zinc
Phosphorus
Phosphorus
Sodium
Sodium
Manganese
Manganese
Selenium
Selenium
193%
479%
111%
1380%
211%
73%
63%
3.3%
651%
25%
4
100 g
300 g
1 cup, in shell, edible yield (7 nuts) - 28g 1 oz (14 halves) - 28.35g 1 cup, ground - 80g 1 cup, chopped - 117g 1 cup pieces or chips - 120g
Magnesium
Magnesium
Calcium
Calcium
Potassium
Potassium
Iron
Iron
Copper
Copper
Zinc
Zinc
Phosphorus
Phosphorus
Sodium
Sodium
Manganese
Manganese
Selenium
Selenium
113%
29%
39%
109%
529%
84%
148%
0.26%
445%
27%
Vitamin Comparison
Vitamin comparison score is based on the number of vitamins by which one or the other food is richer. The "coverage" charts below show how much of the daily needs can be covered by 300 grams of the food.
9
100 g
300 g
0.25 tsp - 0.5g 1 tsp, ground - 1.8g
Vitamin C
Vit. C
Vitamin D
Vit. D
Vitamin A
Vit. A
Vitamin E
Vit. E
Vitamin B1
Vit. B1
Vitamin B2
Vit. B2
Vitamin B3
Vit. B3
Vitamin B5
Vit. B5
Vitamin B6
Vit. B6
Vitamin B12
Vit. B12
Vitamin K
Vit. K
Folate
Folate
7.7%
0%
28%
365%
44%
122%
87%
55%
241%
0%
1554%
178%
1
100 g
300 g
1 cup, in shell, edible yield (7 nuts) - 28g 1 oz (14 halves) - 28.35g 1 cup, ground - 80g 1 cup, chopped - 117g 1 cup pieces or chips - 120g
Vitamin C
Vit. C
Vitamin D
Vit. D
Vitamin A
Vit. A
Vitamin E
Vit. E
Vitamin B1
Vit. B1
Vitamin B2
Vit. B2
Vitamin B3
Vit. B3
Vitamin B5
Vit. B5
Vitamin B6
Vit. B6
Vitamin B12
Vit. B12
Vitamin K
Vit. K
Folate
Folate
4.3%
0%
0.33%
14%
85%
35%
21%
34%
124%
0%
6.8%
74%
All nutrients comparison - raw data values
Nutrient
DV% diff.
Vitamin K
621.7µg
2.7µg
516%
Iron
36.8mg
2.91mg
424%
Polyunsaturated fat
1.369g
47.174g
305%
Calcium
1597mg
98mg
150%
Fiber
42.5g
6.7g
143%
Vitamin E
18.26mg
0.7mg
117%
Copper
0.633mg
1.586mg
106%
Fats
4.28g
65.21g
94%
Manganese
4.99mg
3.414mg
69%
Vitamin B6
1.044mg
0.537mg
39%
Folate
237µg
98µg
35%
Vitamin B2
0.528mg
0.15mg
29%
Phosphorus
148mg
346mg
28%
Magnesium
270mg
158mg
27%
Potassium
1260mg
441mg
24%
Vitamin B3
4.64mg
1.125mg
22%
Saturated fat
1.551g
6.126g
21%
Monounsaturated fat
0.716g
8.933g
21%
Calories
265kcal
654kcal
19%
Carbs
68.92g
13.71g
18%
Vitamin B1
0.177mg
0.341mg
14%
Protein
9g
15.23g
12%
Vitamin A
85µg
1µg
9%
Vitamin B5
0.921mg
0.57mg
7%
Zinc
2.69mg
3.09mg
4%
Vitamin C
2.3mg
1.3mg
1%
Sodium
25mg
2mg
1%
Selenium
4.5µg
4.9µg
1%
Choline
32.3mg
39.2mg
1%
Fructose
1.13g
0.09g
1%
Protein per 100 calories
3.4g
2.3g
N/A
Calories per 10 g protein
294kcal
429kcal
N/A
Weight per 100 calories
38g
15g
N/A
Unsaturated / Saturated Fat ratio
1.3
9.2
N/A
Net carbs
26.42g
7.01g
N/A
Sugar
4.09g
2.61g
N/A
Starch
0.06g
0%
Tryptophan
0.203mg
0.17mg
0%
Threonine
0.322mg
0.596mg
0%
Isoleucine
0.441mg
0.625mg
0%
Leucine
0.78mg
1.17mg
0%
Lysine
0.5mg
0.424mg
0%
Methionine
0.127mg
0.236mg
0%
Phenylalanine
0.449mg
0.711mg
0%
Valine
0.585mg
0.753mg
0%
Histidine
0.144mg
0.391mg
0%
Omega-3 - ALA
0.621g
N/A
Macronutrient Comparison
Macronutrient breakdown side-by-side comparison
3
9%
4%
69%
10%
8%
Protein:
9 g
Fats:
4.28 g
Carbs:
68.92 g
Water:
9.93 g
Other:
7.87 g
2
15%
65%
14%
4%
2%
Protein:
15.23 g
Fats:
65.21 g
Carbs:
13.71 g
Water:
4.07 g
Other:
1.78 g
Contains
more
Carbs Carbs
+402.7%
Contains
more
Water Water
+144%
Contains
more
Other Other
+342.1%
Contains
more
Protein Protein
+69.2%
Contains
more
Fats Fats
+1423.6%
Fat Type Comparison
Fat type breakdown side-by-side comparison
1
43%
20%
38%
Saturated fat:
Sat. Fat
1.551 g
Monounsaturated fat:
Mono. Fat
0.716 g
Polyunsaturated fat:
Poly. Fat
1.369 g
2
10%
14%
76%
Saturated fat:
Sat. Fat
6.126 g
Monounsaturated fat:
Mono. Fat
8.933 g
Polyunsaturated fat:
Poly. Fat
47.174 g
Contains
less
Sat. Fat Saturated fat
-74.7%
Contains
more
Mono. Fat Monounsaturated fat
+1147.6%
Contains
more
Poly. Fat Polyunsaturated fat
+3345.9%
Carbohydrate type comparison
Carbohydrate type breakdown side-by-side comparison
3
22%
46%
28%
4%
Starch:
0 g
Sucrose:
0.91 g
Glucose:
1.9 g
Fructose:
1.13 g
Lactose:
0 g
Maltose:
0 g
Galactose:
0.15 g
2
2%
91%
3%
3%
Starch:
0.06 g
Sucrose:
2.43 g
Glucose:
0.08 g
Fructose:
0.09 g
Lactose:
0 g
Maltose:
0 g
Galactose:
0 g
Contains
more
Glucose Glucose
+2275%
Contains
more
Fructose Fructose
+1155.6%
Contains
more
Galactose Galactose
+∞%
Contains
more
Starch Starch
+∞%
Contains
more
Sucrose Sucrose
+167%
~equal in
Lactose
~0g
~equal in
Maltose
~0g