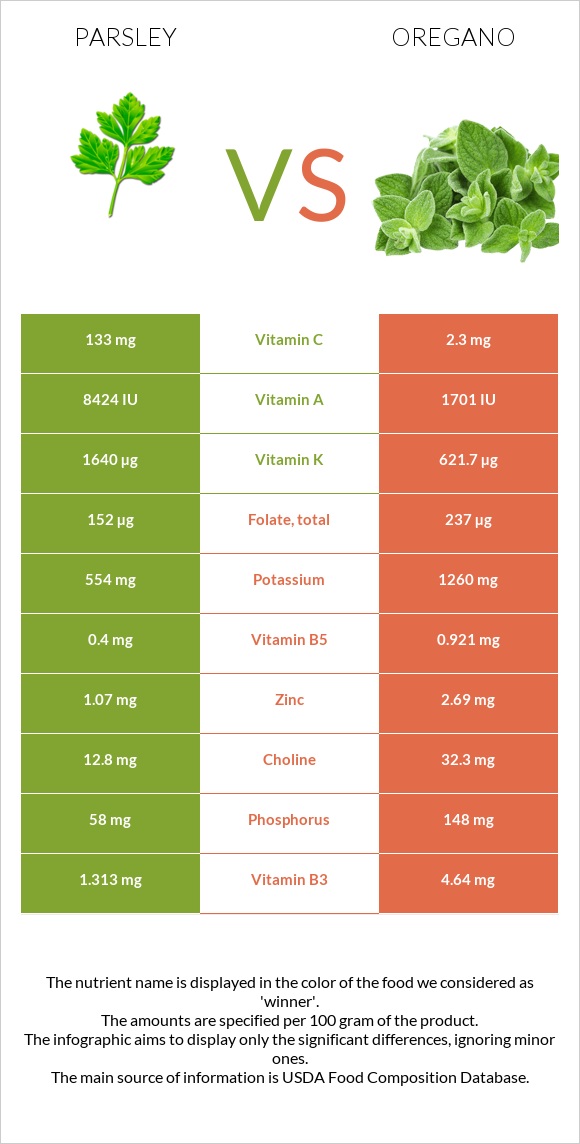
The main differences between parsley and oregano Parsley is richer in vitamin K, vitamin C, and vitamin A, yet oregano is richer in iron, manganese, fiber, calcium, vitamin E, vitamin B6, and copper. Daily need coverage for vitamin K for parsley is 849% higher. Parsley contains 58 times more vitamin C than oregano. Parsley contains 133mg of vitamin C, while oregano contains 2.3mg. Oregano has a lower glycemic index than parsley. Food types used in this article are Parsley, fresh and Spices, oregano, dried .
Infographic
Mineral Comparison
Mineral comparison score is based on the number of minerals by which one or the other food is richer. The "coverage" charts below show how much of the daily needs can be covered by 300 grams of the food.
0
100 g
300 g
1 tbsp - 3.8g 10 sprigs - 10g 1 cup chopped - 60g
Magnesium
Magnesium
Calcium
Calcium
Potassium
Potassium
Iron
Iron
Copper
Copper
Zinc
Zinc
Phosphorus
Phosphorus
Sodium
Sodium
Manganese
Manganese
Selenium
Selenium
36%
41%
49%
233%
50%
29%
25%
7.3%
21%
0.55%
10
100 g
300 g
0.25 tsp - 0.5g 1 tsp, ground - 1.8g
Magnesium
Magnesium
Calcium
Calcium
Potassium
Potassium
Iron
Iron
Copper
Copper
Zinc
Zinc
Phosphorus
Phosphorus
Sodium
Sodium
Manganese
Manganese
Selenium
Selenium
193%
479%
111%
1380%
211%
73%
63%
3.3%
651%
25%
Vitamin Comparison
Vitamin comparison score is based on the number of vitamins by which one or the other food is richer. The "coverage" charts below show how much of the daily needs can be covered by 300 grams of the food.
3
100 g
300 g
1 tbsp - 3.8g 10 sprigs - 10g 1 cup chopped - 60g
Vitamin C
Vit. C
Vitamin D
Vit. D
Vitamin A
Vit. A
Vitamin E
Vit. E
Vitamin B1
Vit. B1
Vitamin B2
Vit. B2
Vitamin B3
Vit. B3
Vitamin B5
Vit. B5
Vitamin B6
Vit. B6
Vitamin B12
Vit. B12
Vitamin K
Vit. K
Folate
Folate
443%
0%
140%
15%
22%
23%
25%
24%
21%
0%
4100%
114%
7
100 g
300 g
0.25 tsp - 0.5g 1 tsp, ground - 1.8g
Vitamin C
Vit. C
Vitamin D
Vit. D
Vitamin A
Vit. A
Vitamin E
Vit. E
Vitamin B1
Vit. B1
Vitamin B2
Vit. B2
Vitamin B3
Vit. B3
Vitamin B5
Vit. B5
Vitamin B6
Vit. B6
Vitamin B12
Vit. B12
Vitamin K
Vit. K
Folate
Folate
7.7%
0%
28%
365%
44%
122%
87%
55%
241%
0%
1554%
178%
All nutrients comparison - raw data values
Nutrient
DV% diff.
Vitamin K
1640µg
621.7µg
849%
Iron
6.2mg
36.8mg
383%
Manganese
0.16mg
4.99mg
210%
Fiber
3.3g
42.5g
157%
Calcium
138mg
1597mg
146%
Vitamin C
133mg
2.3mg
145%
Vitamin E
0.75mg
18.26mg
117%
Vitamin B6
0.09mg
1.044mg
73%
Copper
0.149mg
0.633mg
54%
Magnesium
50mg
270mg
52%
Vitamin A
421µg
85µg
37%
Vitamin B2
0.098mg
0.528mg
33%
Carbs
6.33g
68.92g
21%
Potassium
554mg
1260mg
21%
Vitamin B3
1.313mg
4.64mg
21%
Folate
152µg
237µg
21%
Zinc
1.07mg
2.69mg
15%
Phosphorus
58mg
148mg
13%
Protein
2.97g
9g
12%
Calories
36kcal
265kcal
11%
Vitamin B5
0.4mg
0.921mg
10%
Selenium
0.1µg
4.5µg
8%
Vitamin B1
0.086mg
0.177mg
8%
Polyunsaturated fat
0.124g
1.369g
8%
Saturated fat
0.132g
1.551g
6%
Fats
0.79g
4.28g
5%
Choline
12.8mg
32.3mg
4%
Sodium
56mg
25mg
1%
Monounsaturated fat
0.295g
0.716g
1%
Fructose
1.13g
1%
Protein per 100 calories
8.3g
3.4g
N/A
Calories per 10 g protein
121kcal
294kcal
N/A
Weight per 100 calories
278g
38g
N/A
Unsaturated / Saturated Fat ratio
3.2
1.3
N/A
Net carbs
3.03g
26.42g
N/A
Sugar
0.85g
4.09g
N/A
Tryptophan
0.045mg
0.203mg
0%
Threonine
0.122mg
0.322mg
0%
Isoleucine
0.118mg
0.441mg
0%
Leucine
0.204mg
0.78mg
0%
Lysine
0.181mg
0.5mg
0%
Methionine
0.042mg
0.127mg
0%
Phenylalanine
0.145mg
0.449mg
0%
Valine
0.172mg
0.585mg
0%
Histidine
0.061mg
0.144mg
0%
Omega-3 - ALA
0.621g
N/A
Macronutrient Comparison
Macronutrient breakdown side-by-side comparison
1
3%
6%
88%
2%
Protein:
2.97 g
Fats:
0.79 g
Carbs:
6.33 g
Water:
87.71 g
Other:
2.2 g
4
9%
4%
69%
10%
8%
Protein:
9 g
Fats:
4.28 g
Carbs:
68.92 g
Water:
9.93 g
Other:
7.87 g
Contains
more
Water Water
+783.3%
Contains
more
Protein Protein
+203%
Contains
more
Fats Fats
+441.8%
Contains
more
Carbs Carbs
+988.8%
Contains
more
Other Other
+257.7%
Fat Type Comparison
Fat type breakdown side-by-side comparison
1
24%
54%
23%
Saturated fat:
Sat. Fat
0.132 g
Monounsaturated fat:
Mono. Fat
0.295 g
Polyunsaturated fat:
Poly. Fat
0.124 g
2
43%
20%
38%
Saturated fat:
Sat. Fat
1.551 g
Monounsaturated fat:
Mono. Fat
0.716 g
Polyunsaturated fat:
Poly. Fat
1.369 g
Contains
less
Sat. Fat Saturated fat
-91.5%
Contains
more
Mono. Fat Monounsaturated fat
+142.7%
Contains
more
Poly. Fat Polyunsaturated fat
+1004%