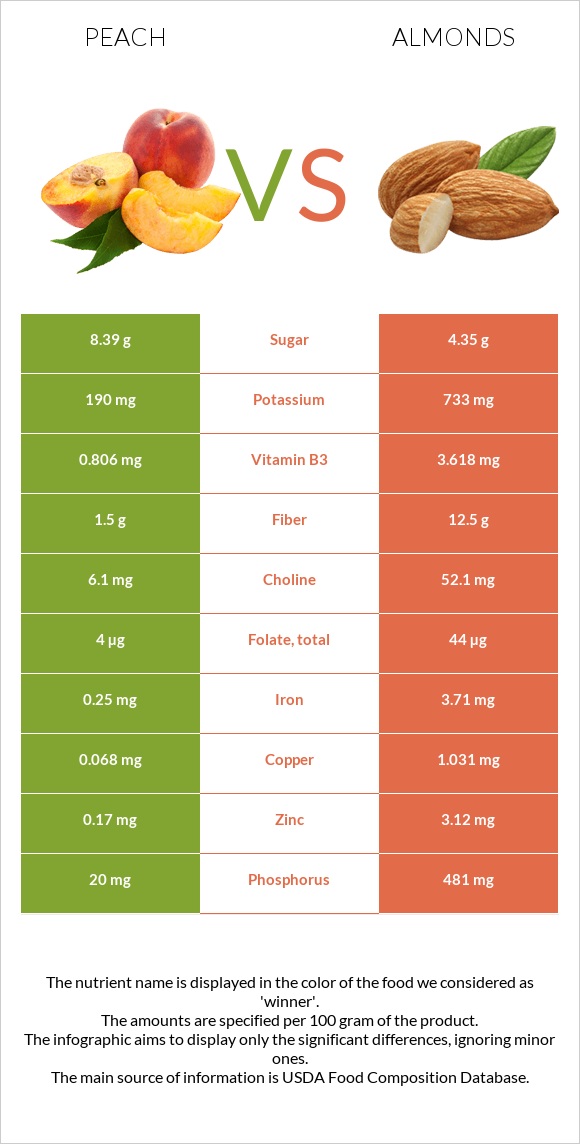
What are the differences between peach and almonds? Almonds are richer than peach in vitamin E, copper, manganese, vitamin B2, phosphorus, magnesium, fiber, iron, zinc, and calcium. Almonds' daily need coverage for vitamin E is 166% more. The glycemic index of almonds is lower. We used Peaches, yellow, raw and Nuts, almonds types in this article.
Infographic
Mineral Comparison
Mineral comparison score is based on the number of minerals by which one or the other food is richer. The "coverage" charts below show how much of the daily needs can be covered by 300 grams of the food.
1
100 g
300 g
1 small (2-1/2" dia) - 130g 1 NLEA serving - 147g 1 medium (2-2/3" dia) - 150g 1 cup slices - 154g 1 large (2-3/4" dia) - 175g 1 extra large (3" dia) - 224g
Magnesium
Magnesium
Calcium
Calcium
Potassium
Potassium
Iron
Iron
Copper
Copper
Zinc
Zinc
Phosphorus
Phosphorus
Sodium
Sodium
Manganese
Manganese
Selenium
Selenium
6.4%
1.8%
17%
9.4%
23%
4.6%
8.6%
0%
8%
0.55%
9
100 g
300 g
1 almond - 1.2g 1 oz (23 whole kernels) - 28.35g 1 cup, sliced - 92g 1 cup, ground - 95g 1 cup, slivered - 108g 1 cup, whole - 143g
Magnesium
Magnesium
Calcium
Calcium
Potassium
Potassium
Iron
Iron
Copper
Copper
Zinc
Zinc
Phosphorus
Phosphorus
Sodium
Sodium
Manganese
Manganese
Selenium
Selenium
193%
81%
65%
139%
344%
85%
206%
0.13%
284%
22%
Vitamin Comparison
Vitamin comparison score is based on the number of vitamins by which one or the other food is richer. The "coverage" charts below show how much of the daily needs can be covered by 300 grams of the food.
3
100 g
300 g
1 small (2-1/2" dia) - 130g 1 NLEA serving - 147g 1 medium (2-2/3" dia) - 150g 1 cup slices - 154g 1 large (2-3/4" dia) - 175g 1 extra large (3" dia) - 224g
Vitamin C
Vit. C
Vitamin D
Vit. D
Vitamin A
Vit. A
Vitamin E
Vit. E
Vitamin B1
Vit. B1
Vitamin B2
Vit. B2
Vitamin B3
Vit. B3
Vitamin B5
Vit. B5
Vitamin B6
Vit. B6
Vitamin B12
Vit. B12
Vitamin K
Vit. K
Folate
Folate
22%
0%
5.3%
15%
6%
7.2%
15%
9.2%
5.8%
0%
6.5%
3%
7
100 g
300 g
1 almond - 1.2g 1 oz (23 whole kernels) - 28.35g 1 cup, sliced - 92g 1 cup, ground - 95g 1 cup, slivered - 108g 1 cup, whole - 143g
Vitamin C
Vit. C
Vitamin D
Vit. D
Vitamin A
Vit. A
Vitamin E
Vit. E
Vitamin B1
Vit. B1
Vitamin B2
Vit. B2
Vitamin B3
Vit. B3
Vitamin B5
Vit. B5
Vitamin B6
Vit. B6
Vitamin B12
Vit. B12
Vitamin K
Vit. K
Folate
Folate
0%
0%
0%
513%
51%
263%
68%
28%
32%
0%
0%
33%
All nutrients comparison - raw data values
Nutrient
DV% diff.
Vitamin E
0.73mg
25.63mg
166%
Copper
0.068mg
1.031mg
107%
Manganese
0.061mg
2.179mg
92%
Vitamin B2
0.031mg
1.138mg
85%
Polyunsaturated fat
0.086g
12.329g
82%
Monounsaturated fat
0.067g
31.551g
79%
Fats
0.25g
49.93g
76%
Phosphorus
20mg
481mg
66%
Magnesium
9mg
270mg
62%
Fiber
1.5g
12.5g
44%
Iron
0.25mg
3.71mg
43%
Protein
0.91g
21.15g
40%
Calories
39kcal
579kcal
27%
Zinc
0.17mg
3.12mg
27%
Calcium
6mg
269mg
26%
Vitamin B3
0.806mg
3.618mg
18%
Saturated fat
0.019g
3.802g
17%
Potassium
190mg
733mg
16%
Vitamin B1
0.024mg
0.205mg
15%
Folate
4µg
44µg
10%
Vitamin B6
0.025mg
0.137mg
9%
Choline
6.1mg
52.1mg
8%
Vitamin C
6.6mg
0mg
7%
Selenium
0.1µg
4.1µg
7%
Vitamin B5
0.153mg
0.471mg
6%
Carbs
9.54g
21.55g
4%
Vitamin A
16µg
0µg
2%
Vitamin K
2.6µg
0µg
2%
Fructose
1.53g
0.11g
2%
Protein per 100 calories
2.3g
3.7g
N/A
Calories per 10 g protein
429kcal
274kcal
N/A
Weight per 100 calories
256g
17g
N/A
Unsaturated / Saturated Fat ratio
8.1
12
N/A
Net carbs
8.04g
9.05g
N/A
Sugar
8.39g
4.35g
N/A
Starch
0g
0.72g
0%
Sodium
0mg
1mg
0%
Trans fat
0g
0.015g
N/A
Tryptophan
0.01mg
0.211mg
0%
Threonine
0.016mg
0.601mg
0%
Isoleucine
0.017mg
0.751mg
0%
Leucine
0.027mg
1.473mg
0%
Lysine
0.03mg
0.568mg
0%
Methionine
0.01mg
0.157mg
0%
Phenylalanine
0.019mg
1.132mg
0%
Valine
0.022mg
0.855mg
0%
Histidine
0.013mg
0.539mg
0%
Omega-3 - ALA
0.003g
N/A
Omega-6 - Eicosadienoic acid
0.002g
N/A
Omega-6 - Linoleic acid
12.32g
N/A
Macronutrient Comparison
Macronutrient breakdown side-by-side comparison
1
10%
89%
Protein:
0.91 g
Fats:
0.25 g
Carbs:
9.54 g
Water:
88.87 g
Other:
0.43 g
4
21%
50%
22%
4%
3%
Protein:
21.15 g
Fats:
49.93 g
Carbs:
21.55 g
Water:
4.41 g
Other:
2.96 g
Contains
more
Water Water
+1915.2%
Contains
more
Protein Protein
+2224.2%
Contains
more
Fats Fats
+19872%
Contains
more
Carbs Carbs
+125.9%
Contains
more
Other Other
+588.4%
Fat Type Comparison
Fat type breakdown side-by-side comparison
1
11%
39%
50%
Saturated fat:
Sat. Fat
0.019 g
Monounsaturated fat:
Mono. Fat
0.067 g
Polyunsaturated fat:
Poly. Fat
0.086 g
2
8%
66%
26%
Saturated fat:
Sat. Fat
3.802 g
Monounsaturated fat:
Mono. Fat
31.551 g
Polyunsaturated fat:
Poly. Fat
12.329 g
Contains
less
Sat. Fat Saturated fat
-99.5%
Contains
more
Mono. Fat Monounsaturated fat
+46991%
Contains
more
Poly. Fat Polyunsaturated fat
+14236%
Carbohydrate type comparison
Carbohydrate type breakdown side-by-side comparison
4
57%
23%
18%
Starch:
0 g
Sucrose:
4.76 g
Glucose:
1.95 g
Fructose:
1.53 g
Lactose:
0 g
Maltose:
0.08 g
Galactose:
0.06 g
2
14%
78%
3%
2%
Starch:
0.72 g
Sucrose:
3.95 g
Glucose:
0.17 g
Fructose:
0.11 g
Lactose:
0 g
Maltose:
0.04 g
Galactose:
0.07 g
Contains
more
Sucrose Sucrose
+20.5%
Contains
more
Glucose Glucose
+1047.1%
Contains
more
Fructose Fructose
+1290.9%
Contains
more
Maltose Maltose
+100%
Contains
more
Starch Starch
+∞%
Contains
more
Galactose Galactose
+16.7%