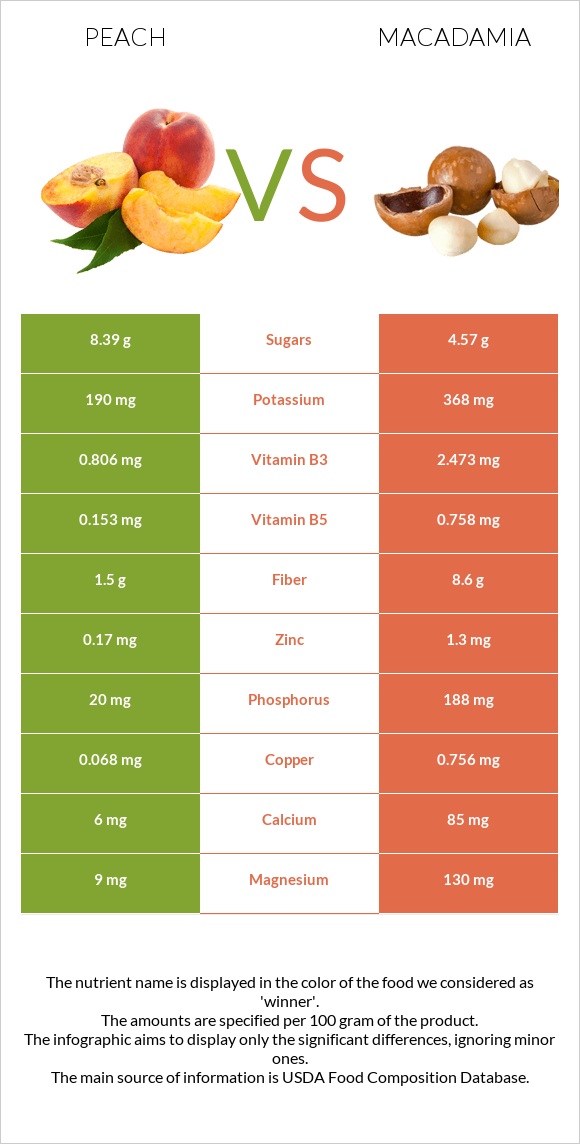
What are the differences between peach and macadamia? Macadamia is richer than peach in manganese, vitamin B1, copper, iron, magnesium, fiber, phosphorus, vitamin B6, and vitamin B5. Macadamia's daily need coverage for manganese is 177% more. The amount of saturated fat in peach is lower. The glycemic index of macadamia is lower. We used Peaches, yellow, raw and Nuts, macadamia nuts, raw types in this article.
Infographic
Mineral Comparison
Mineral comparison score is based on the number of minerals by which one or the other food is richer. The "coverage" charts below show how much of the daily needs can be covered by 300 grams of the food.
1
100 g
300 g
1 small (2-1/2" dia) - 130g 1 NLEA serving - 147g 1 medium (2-2/3" dia) - 150g 1 cup slices - 154g 1 large (2-3/4" dia) - 175g 1 extra large (3" dia) - 224g
Magnesium
Magnesium
Calcium
Calcium
Potassium
Potassium
Iron
Iron
Copper
Copper
Zinc
Zinc
Phosphorus
Phosphorus
Sodium
Sodium
Manganese
Manganese
Selenium
Selenium
6.4%
1.8%
17%
9.4%
23%
4.6%
8.6%
0%
8%
0.55%
9
100 g
300 g
1 oz (10-12 kernels) - 28.35g 1 cup, whole or halves - 134g
Magnesium
Magnesium
Calcium
Calcium
Potassium
Potassium
Iron
Iron
Copper
Copper
Zinc
Zinc
Phosphorus
Phosphorus
Sodium
Sodium
Manganese
Manganese
Selenium
Selenium
93%
26%
32%
138%
252%
35%
81%
0.65%
539%
20%
Vitamin Comparison
Vitamin comparison score is based on the number of vitamins by which one or the other food is richer. The "coverage" charts below show how much of the daily needs can be covered by 300 grams of the food.
4
100 g
300 g
1 small (2-1/2" dia) - 130g 1 NLEA serving - 147g 1 medium (2-2/3" dia) - 150g 1 cup slices - 154g 1 large (2-3/4" dia) - 175g 1 extra large (3" dia) - 224g
Vitamin C
Vit. C
Vitamin D
Vit. D
Vitamin A
Vit. A
Vitamin E
Vit. E
Vitamin B1
Vit. B1
Vitamin B2
Vit. B2
Vitamin B3
Vit. B3
Vitamin B5
Vit. B5
Vitamin B6
Vit. B6
Vitamin B12
Vit. B12
Vitamin K
Vit. K
Folate
Folate
22%
0%
5.3%
15%
6%
7.2%
15%
9.2%
5.8%
0%
6.5%
3%
6
100 g
300 g
1 oz (10-12 kernels) - 28.35g 1 cup, whole or halves - 134g
Vitamin C
Vit. C
Vitamin D
Vit. D
Vitamin A
Vit. A
Vitamin E
Vit. E
Vitamin B1
Vit. B1
Vitamin B2
Vit. B2
Vitamin B3
Vit. B3
Vitamin B5
Vit. B5
Vitamin B6
Vit. B6
Vitamin B12
Vit. B12
Vitamin K
Vit. K
Folate
Folate
4%
0%
0%
11%
299%
37%
46%
45%
63%
0%
0%
8.3%
All nutrients comparison - raw data values
Nutrient
DV% diff.
Manganese
0.061mg
4.131mg
177%
Monounsaturated fat
0.067g
58.877g
147%
Fats
0.25g
75.77g
116%
Vitamin B1
0.024mg
1.195mg
98%
Copper
0.068mg
0.756mg
76%
Saturated fat
0.019g
12.061g
55%
Iron
0.25mg
3.69mg
43%
Calories
39kcal
718kcal
34%
Magnesium
9mg
130mg
29%
Fiber
1.5g
8.6g
28%
Phosphorus
20mg
188mg
24%
Vitamin B6
0.025mg
0.275mg
19%
Protein
0.91g
7.91g
14%
Vitamin B5
0.153mg
0.758mg
12%
Zinc
0.17mg
1.3mg
10%
Vitamin B2
0.031mg
0.162mg
10%
Vitamin B3
0.806mg
2.473mg
10%
Polyunsaturated fat
0.086g
1.502g
9%
Calcium
6mg
85mg
8%
Vitamin C
6.6mg
1.2mg
6%
Selenium
0.1µg
3.6µg
6%
Potassium
190mg
368mg
5%
Vitamin A
16µg
0µg
2%
Vitamin K
2.6µg
2%
Folate
4µg
11µg
2%
Fructose
1.53g
0.07g
2%
Carbs
9.54g
13.82g
1%
Vitamin E
0.73mg
0.54mg
1%
Choline
6.1mg
1%
Protein per 100 calories
2.3g
1.1g
N/A
Calories per 10 g protein
429kcal
908kcal
N/A
Weight per 100 calories
256g
14g
N/A
Unsaturated / Saturated Fat ratio
8.1
5
N/A
Net carbs
8.04g
5.22g
N/A
Sugar
8.39g
4.57g
N/A
Starch
0g
1.05g
0%
Sodium
0mg
5mg
0%
Tryptophan
0.01mg
0.067mg
0%
Threonine
0.016mg
0.37mg
0%
Isoleucine
0.017mg
0.314mg
0%
Leucine
0.027mg
0.602mg
0%
Lysine
0.03mg
0.018mg
0%
Methionine
0.01mg
0.023mg
0%
Phenylalanine
0.019mg
0.665mg
0%
Valine
0.022mg
0.363mg
0%
Histidine
0.013mg
0.195mg
0%
Macronutrient Comparison
Macronutrient breakdown side-by-side comparison
1
10%
89%
Protein:
0.91 g
Fats:
0.25 g
Carbs:
9.54 g
Water:
88.87 g
Other:
0.43 g
4
8%
76%
14%
Protein:
7.91 g
Fats:
75.77 g
Carbs:
13.82 g
Water:
1.36 g
Other:
1.14 g
Contains
more
Water Water
+6434.6%
Contains
more
Protein Protein
+769.2%
Contains
more
Fats Fats
+30208%
Contains
more
Carbs Carbs
+44.9%
Contains
more
Other Other
+165.1%
Fat Type Comparison
Fat type breakdown side-by-side comparison
1
11%
39%
50%
Saturated fat:
Sat. Fat
0.019 g
Monounsaturated fat:
Mono. Fat
0.067 g
Polyunsaturated fat:
Poly. Fat
0.086 g
2
17%
81%
2%
Saturated fat:
Sat. Fat
12.061 g
Monounsaturated fat:
Mono. Fat
58.877 g
Polyunsaturated fat:
Poly. Fat
1.502 g
Contains
less
Sat. Fat Saturated fat
-99.8%
Contains
more
Mono. Fat Monounsaturated fat
+87776.1%
Contains
more
Poly. Fat Polyunsaturated fat
+1646.5%
Carbohydrate type comparison
Carbohydrate type breakdown side-by-side comparison
5
57%
23%
18%
Starch:
0 g
Sucrose:
4.76 g
Glucose:
1.95 g
Fructose:
1.53 g
Lactose:
0 g
Maltose:
0.08 g
Galactose:
0.06 g
1
19%
79%
Starch:
1.05 g
Sucrose:
4.43 g
Glucose:
0.07 g
Fructose:
0.07 g
Lactose:
0 g
Maltose:
0 g
Galactose:
0 g
Contains
more
Glucose Glucose
+2685.7%
Contains
more
Fructose Fructose
+2085.7%
Contains
more
Maltose Maltose
+∞%
Contains
more
Galactose Galactose
+∞%
Contains
more
Starch Starch
+∞%
~equal in
Sucrose
~4.43g
~equal in
Lactose
~0g