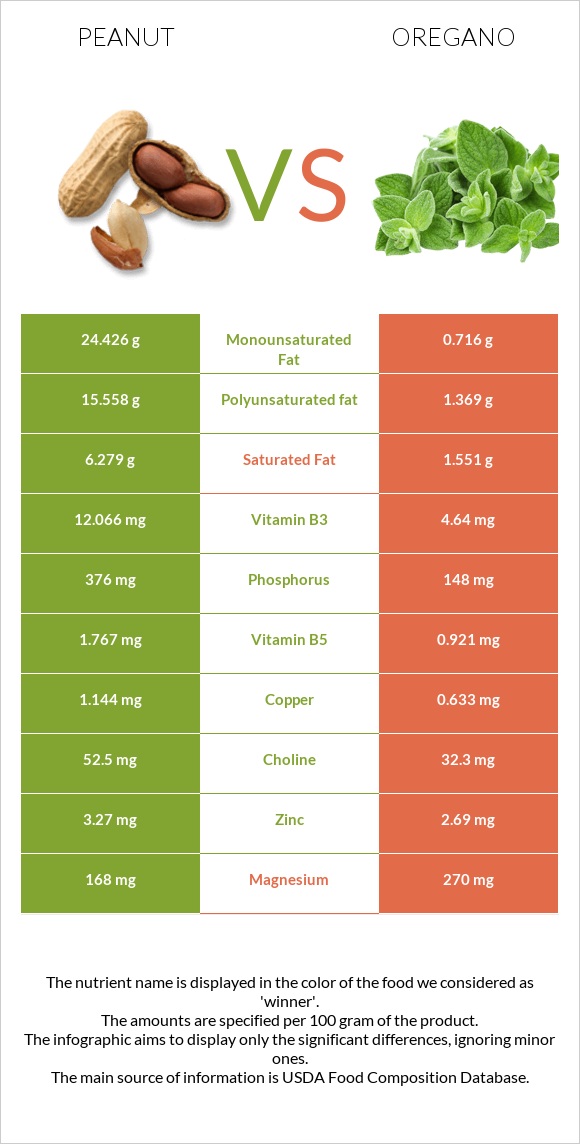
The main differences between peanuts and oregano Peanuts are richer in copper, vitamin B3, and vitamin B1, yet oregano is richer in vitamin K, iron, calcium, fiber, manganese, vitamin E, and vitamin B6. Daily need coverage for vitamin K for oregano is 518% higher. Peanuts contain 4 times more vitamin B1 than oregano. Peanuts contain 0.64mg of vitamin B1, while oregano contains 0.177mg. Food types used in this article are Peanuts, all types, raw and Spices, oregano, dried .
Infographic
Mineral Comparison
Mineral comparison score is based on the number of minerals by which one or the other food is richer. The "coverage" charts below show how much of the daily needs can be covered by 300 grams of the food.
5
100 g
300 g
1 oz - 28.35g 1 cup - 146g
Magnesium
Magnesium
Calcium
Calcium
Potassium
Potassium
Iron
Iron
Copper
Copper
Zinc
Zinc
Phosphorus
Phosphorus
Sodium
Sodium
Manganese
Manganese
Selenium
Selenium
120%
28%
62%
172%
381%
89%
161%
2.3%
252%
39%
5
100 g
300 g
0.25 tsp - 0.5g 1 tsp, ground - 1.8g
Magnesium
Magnesium
Calcium
Calcium
Potassium
Potassium
Iron
Iron
Copper
Copper
Zinc
Zinc
Phosphorus
Phosphorus
Sodium
Sodium
Manganese
Manganese
Selenium
Selenium
193%
479%
111%
1380%
211%
73%
63%
3.3%
651%
25%
Vitamin Comparison
Vitamin comparison score is based on the number of vitamins by which one or the other food is richer. The "coverage" charts below show how much of the daily needs can be covered by 300 grams of the food.
3
100 g
300 g
1 oz - 28.35g 1 cup - 146g
Vitamin C
Vit. C
Vitamin D
Vit. D
Vitamin A
Vit. A
Vitamin E
Vit. E
Vitamin B1
Vit. B1
Vitamin B2
Vit. B2
Vitamin B3
Vit. B3
Vitamin B5
Vit. B5
Vitamin B6
Vit. B6
Vitamin B12
Vit. B12
Vitamin K
Vit. K
Folate
Folate
0%
0%
0%
167%
160%
31%
226%
106%
80%
0%
0%
180%
6
100 g
300 g
0.25 tsp - 0.5g 1 tsp, ground - 1.8g
Vitamin C
Vit. C
Vitamin D
Vit. D
Vitamin A
Vit. A
Vitamin E
Vit. E
Vitamin B1
Vit. B1
Vitamin B2
Vit. B2
Vitamin B3
Vit. B3
Vitamin B5
Vit. B5
Vitamin B6
Vit. B6
Vitamin B12
Vit. B12
Vitamin K
Vit. K
Folate
Folate
7.7%
0%
28%
365%
44%
122%
87%
55%
241%
0%
1554%
178%
All nutrients comparison - raw data values
Nutrient
DV% diff.
Vitamin K
0µg
621.7µg
518%
Iron
4.58mg
36.8mg
403%
Calcium
92mg
1597mg
151%
Fiber
8.5g
42.5g
136%
Manganese
1.934mg
4.99mg
133%
Polyunsaturated fat
15.558g
1.369g
95%
Fats
49.24g
4.28g
69%
Vitamin E
8.33mg
18.26mg
66%
Monounsaturated fat
24.426g
0.716g
59%
Copper
1.144mg
0.633mg
57%
Vitamin B6
0.348mg
1.044mg
54%
Vitamin B3
12.066mg
4.64mg
46%
Vitamin B1
0.64mg
0.177mg
39%
Protein
25.8g
9g
34%
Phosphorus
376mg
148mg
33%
Vitamin B2
0.135mg
0.528mg
30%
Magnesium
168mg
270mg
24%
Saturated fat
6.279g
1.551g
21%
Carbs
16.13g
68.92g
18%
Vitamin B5
1.767mg
0.921mg
17%
Potassium
705mg
1260mg
16%
Calories
567kcal
265kcal
15%
Vitamin A
0µg
85µg
9%
Zinc
3.27mg
2.69mg
5%
Selenium
7.2µg
4.5µg
5%
Choline
52.5mg
32.3mg
4%
Vitamin C
0mg
2.3mg
3%
Folate
240µg
237µg
1%
Fructose
1.13g
1%
Protein per 100 calories
4.6g
3.4g
N/A
Calories per 10 g protein
220kcal
294kcal
N/A
Weight per 100 calories
18g
38g
N/A
Unsaturated / Saturated Fat ratio
6.4
1.3
N/A
Net carbs
7.63g
26.42g
N/A
Sugar
4.72g
4.09g
N/A
Sodium
18mg
25mg
0%
Tryptophan
0.25mg
0.203mg
0%
Threonine
0.883mg
0.322mg
0%
Isoleucine
0.907mg
0.441mg
0%
Leucine
1.672mg
0.78mg
0%
Lysine
0.926mg
0.5mg
0%
Methionine
0.317mg
0.127mg
0%
Phenylalanine
1.377mg
0.449mg
0%
Valine
1.082mg
0.585mg
0%
Histidine
0.652mg
0.144mg
0%
Omega-3 - ALA
0.621g
N/A
Macronutrient Comparison
Macronutrient breakdown side-by-side comparison
2
26%
49%
16%
7%
2%
Protein:
25.8 g
Fats:
49.24 g
Carbs:
16.13 g
Water:
6.5 g
Other:
2.33 g
3
9%
4%
69%
10%
8%
Protein:
9 g
Fats:
4.28 g
Carbs:
68.92 g
Water:
9.93 g
Other:
7.87 g
Contains
more
Protein Protein
+186.7%
Contains
more
Fats Fats
+1050.5%
Contains
more
Carbs Carbs
+327.3%
Contains
more
Water Water
+52.8%
Contains
more
Other Other
+237.8%
Fat Type Comparison
Fat type breakdown side-by-side comparison
2
14%
53%
34%
Saturated fat:
Sat. Fat
6.279 g
Monounsaturated fat:
Mono. Fat
24.426 g
Polyunsaturated fat:
Poly. Fat
15.558 g
1
43%
20%
38%
Saturated fat:
Sat. Fat
1.551 g
Monounsaturated fat:
Mono. Fat
0.716 g
Polyunsaturated fat:
Poly. Fat
1.369 g
Contains
more
Mono. Fat Monounsaturated fat
+3311.5%
Contains
more
Poly. Fat Polyunsaturated fat
+1036.4%
Contains
less
Sat. Fat Saturated fat
-75.3%