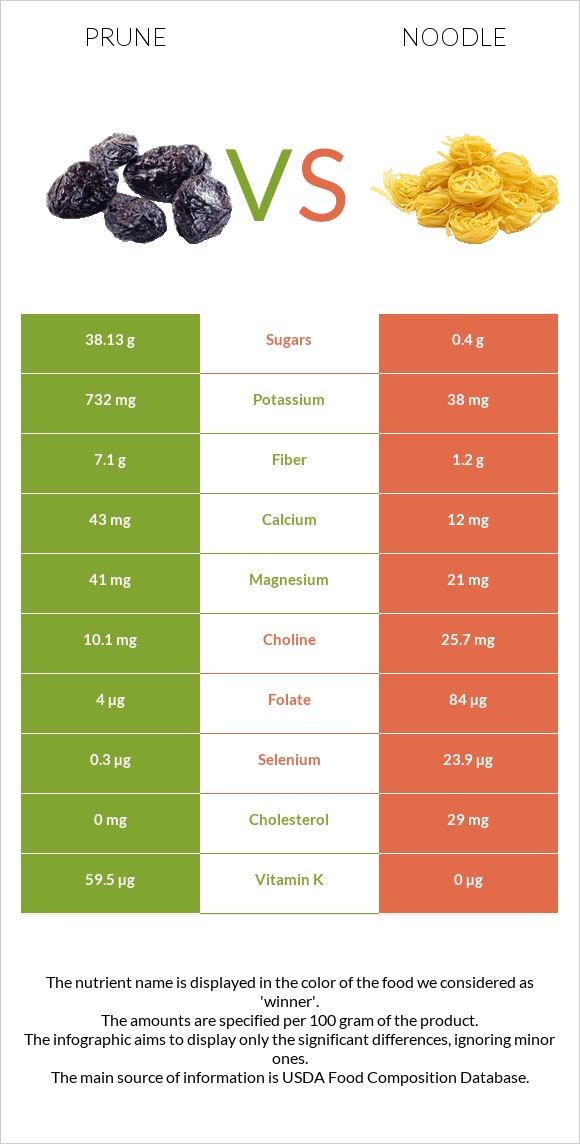
Differences between prunes and noodles Prunes are higher in vitamin K, fiber, potassium, copper, vitamin A, and vitamin B6; however, noodles is richer in selenium, folate, and vitamin B1. Prunes' daily need coverage for vitamin K is 50% higher. Prunes have 37 times more vitamin A than noodles. While prunes have 781 IU of vitamin A, noodles has only 21 IU. Prunes have a lower glycemic index (29) than noodles (50). The food types used in this comparison are Plums, dried (prunes), uncooked and Noodles, egg, enriched, cooked .
Infographic
Mineral Comparison
Mineral comparison score is based on the number of minerals by which one or the other food is richer. The "coverage" charts below show how much of the daily needs can be covered by 300 grams of the food.
5
100 g
300 g
1 prune, pitted - 9.5g 1 cup, pitted - 174g
Magnesium
Magnesium
Calcium
Calcium
Potassium
Potassium
Iron
Iron
Copper
Copper
Zinc
Zinc
Phosphorus
Phosphorus
Sodium
Sodium
Manganese
Manganese
Selenium
Selenium
29%
13%
65%
35%
94%
12%
30%
0.26%
39%
1.6%
4
100 g
300 g
1 cup - 160g
Magnesium
Magnesium
Calcium
Calcium
Potassium
Potassium
Iron
Iron
Copper
Copper
Zinc
Zinc
Phosphorus
Phosphorus
Sodium
Sodium
Manganese
Manganese
Selenium
Selenium
15%
3.6%
3.4%
55%
33%
18%
33%
0.65%
41%
130%
Vitamin Comparison
Vitamin comparison score is based on the number of vitamins by which one or the other food is richer. The "coverage" charts below show how much of the daily needs can be covered by 300 grams of the food.
7
100 g
300 g
1 prune, pitted - 9.5g 1 cup, pitted - 174g
Vitamin C
Vit. C
Vitamin D
Vit. D
Vitamin A
Vit. A
Vitamin E
Vit. E
Vitamin B1
Vit. B1
Vitamin B2
Vit. B2
Vitamin B3
Vit. B3
Vitamin B5
Vit. B5
Vitamin B6
Vit. B6
Vitamin B12
Vit. B12
Vitamin K
Vit. K
Folate
Folate
2%
0%
13%
8.6%
13%
43%
35%
25%
47%
0%
149%
3%
5
100 g
300 g
1 cup - 160g
Vitamin C
Vit. C
Vitamin D
Vit. D
Vitamin A
Vit. A
Vitamin E
Vit. E
Vitamin B1
Vit. B1
Vitamin B2
Vit. B2
Vitamin B3
Vit. B3
Vitamin B5
Vit. B5
Vitamin B6
Vit. B6
Vitamin B12
Vit. B12
Vitamin K
Vit. K
Folate
Folate
0%
1.5%
2%
3.4%
72%
31%
39%
16%
11%
11%
0%
63%
All nutrients comparison - raw data values
Nutrient
DV% diff.
Vitamin K
59.5µg
0µg
50%
Selenium
0.3µg
23.9µg
43%
Fiber
7.1g
1.2g
24%
Potassium
732mg
38mg
20%
Copper
0.281mg
0.098mg
20%
Vitamin B1
0.051mg
0.289mg
20%
Folate
4µg
84µg
20%
Fructose
12.45g
0g
16%
Carbs
63.88g
25.16g
13%
Vitamin B6
0.205mg
0.046mg
12%
Cholesterol
0mg
29mg
10%
Iron
0.93mg
1.47mg
7%
Calories
240kcal
138kcal
5%
Protein
2.18g
4.54g
5%
Magnesium
41mg
21mg
5%
Vitamin A
39µg
6µg
4%
Vitamin B2
0.186mg
0.136mg
4%
Vitamin B12
0µg
0.09µg
4%
Fats
0.38g
2.07g
3%
Calcium
43mg
12mg
3%
Vitamin B5
0.422mg
0.263mg
3%
Choline
10.1mg
25.7mg
3%
Polyunsaturated fat
0.062g
0.552g
3%
Zinc
0.44mg
0.65mg
2%
Starch
5.11g
2%
Vitamin E
0.43mg
0.17mg
2%
Saturated fat
0.088g
0.419g
2%
Vitamin C
0.6mg
0mg
1%
Vitamin D*
0 IU
4 IU
1%
Vitamin D
0µg
0.1µg
1%
Phosphorus
69mg
76mg
1%
Manganese
0.299mg
0.315mg
1%
Vitamin B3
1.882mg
2.077mg
1%
Monounsaturated fat
0.053g
0.581g
1%
Protein per 100 calories
0.91g
3.3g
N/A
Calories per 10 g protein
1101kcal
304kcal
N/A
Weight per 100 calories
42g
72g
N/A
Unsaturated / Saturated Fat ratio
1.3
2.7
N/A
Net carbs
56.78g
23.96g
N/A
Sugar
38.13g
0.4g
N/A
Sodium
2mg
5mg
0%
Trans fat
0.029g
N/A
Tryptophan
0.025mg
0.043mg
0%
Threonine
0.049mg
0.138mg
0%
Isoleucine
0.041mg
0.19mg
0%
Leucine
0.066mg
0.365mg
0%
Lysine
0.05mg
0.137mg
0%
Methionine
0.016mg
0.086mg
0%
Phenylalanine
0.052mg
0.24mg
0%
Valine
0.056mg
0.22mg
0%
Histidine
0.027mg
0.121mg
0%
Macronutrient Comparison
Macronutrient breakdown side-by-side comparison
2
2%
64%
31%
3%
Protein:
2.18 g
Fats:
0.38 g
Carbs:
63.88 g
Water:
30.92 g
Other:
2.64 g
3
5%
2%
25%
68%
Protein:
4.54 g
Fats:
2.07 g
Carbs:
25.16 g
Water:
67.73 g
Other:
0.5 g
Contains
more
Carbs Carbs
+153.9%
Contains
more
Other Other
+428%
Contains
more
Protein Protein
+108.3%
Contains
more
Fats Fats
+444.7%
Contains
more
Water Water
+119%
Fat Type Comparison
Fat type breakdown side-by-side comparison
1
43%
26%
31%
Saturated fat:
Sat. Fat
0.088 g
Monounsaturated fat:
Mono. Fat
0.053 g
Polyunsaturated fat:
Poly. Fat
0.062 g
2
27%
37%
36%
Saturated fat:
Sat. Fat
0.419 g
Monounsaturated fat:
Mono. Fat
0.581 g
Polyunsaturated fat:
Poly. Fat
0.552 g
Contains
less
Sat. Fat Saturated fat
-79%
Contains
more
Mono. Fat Monounsaturated fat
+996.2%
Contains
more
Poly. Fat Polyunsaturated fat
+790.3%
Carbohydrate type comparison
Carbohydrate type breakdown side-by-side comparison
4
12%
59%
29%
Starch:
5.11 g
Sucrose:
0.15 g
Glucose:
25.46 g
Fructose:
12.45 g
Lactose:
0 g
Maltose:
0.06 g
Galactose:
0 g
1
10%
17%
73%
Starch:
0 g
Sucrose:
0.04 g
Glucose:
0.07 g
Fructose:
0 g
Lactose:
0 g
Maltose:
0.3 g
Galactose:
0 g
Contains
more
Starch Starch
+∞%
Contains
more
Sucrose Sucrose
+275%
Contains
more
Glucose Glucose
+36271.4%
Contains
more
Fructose Fructose
+∞%
Contains
more
Maltose Maltose
+400%
~equal in
Lactose
~0g
~equal in
Galactose
~0g