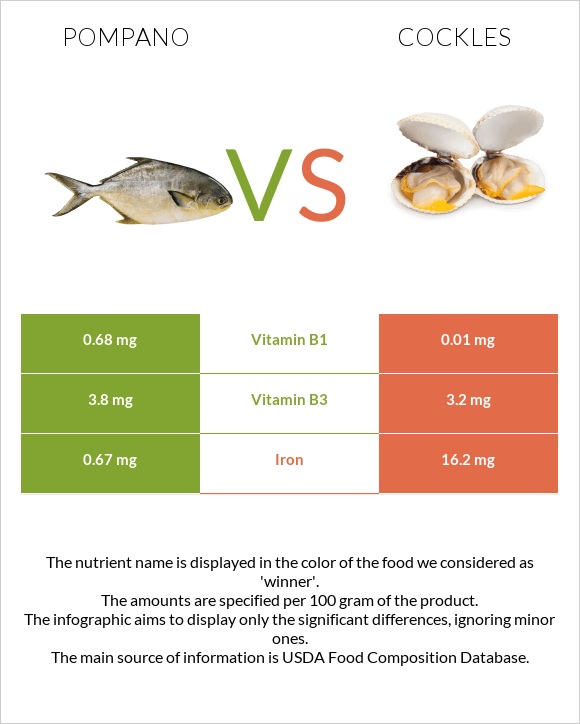
What are the differences between pompano and cockles? Pompano is higher in vitamin B1; however, cockles are richer in iron. Cockles' daily need coverage for iron is 194% more. Cockles contain 68 times less vitamin B1 than pompano. Pompano contains 0.68mg of vitamin B1, while cockles contain 0.01mg. We used Fish, pompano, florida, cooked, dry heat and Cockles, raw (Alaska Native) types in this article.
Infographic
Mineral Comparison
Mineral comparison score is based on the number of minerals by which one or the other food is richer. The "coverage" charts below show how much of the daily needs can be covered by 300 grams of the food.
8
100 g
300 g
3 oz - 85g 1 fillet - 88g
Magnesium
Magnesium
Calcium
Calcium
Potassium
Potassium
Iron
Iron
Copper
Copper
Zinc
Zinc
Phosphorus
Phosphorus
Sodium
Sodium
Manganese
Manganese
Selenium
Selenium
22%
13%
56%
25%
26%
19%
146%
9.9%
3.3%
255%
2
100 g
300 g
Magnesium
Magnesium
Calcium
Calcium
Potassium
Potassium
Iron
Iron
Copper
Copper
Zinc
Zinc
Phosphorus
Phosphorus
Sodium
Sodium
Manganese
Manganese
Selenium
Selenium
0%
9%
0%
608%
0%
0%
0%
0%
0%
0%
Vitamin Comparison
Vitamin comparison score is based on the number of vitamins by which one or the other food is richer. The "coverage" charts below show how much of the daily needs can be covered by 300 grams of the food.
7
100 g
300 g
3 oz - 85g 1 fillet - 88g
Vitamin C
Vit. C
Vitamin D
Vit. D
Vitamin A
Vit. A
Vitamin E
Vit. E
Vitamin B1
Vit. B1
Vitamin B2
Vit. B2
Vitamin B3
Vit. B3
Vitamin B5
Vit. B5
Vitamin B6
Vit. B6
Vitamin B12
Vit. B12
Vitamin K
Vit. K
Folate
Folate
0%
0%
12%
0%
170%
35%
71%
52%
53%
150%
0%
13%
1
100 g
300 g
Vitamin C
Vit. C
Vitamin D
Vit. D
Vitamin A
Vit. A
Vitamin E
Vit. E
Vitamin B1
Vit. B1
Vitamin B2
Vit. B2
Vitamin B3
Vit. B3
Vitamin B5
Vit. B5
Vitamin B6
Vit. B6
Vitamin B12
Vit. B12
Vitamin K
Vit. K
Folate
Folate
0%
0%
0%
0%
2.5%
46%
60%
0%
0%
0%
0%
0%
All nutrients comparison - raw data values
Nutrient
DV% diff.
Iron
0.67mg
16.2mg
194%
Selenium
46.8µg
85%
Vitamin B1
0.68mg
0.01mg
56%
Vitamin B12
1.2µg
50%
Phosphorus
341mg
49%
Cholesterol
64mg
21%
Protein
23.69g
13.5g
20%
Saturated fat
4.499g
20%
Potassium
636mg
19%
Fats
12.14g
0.7g
18%
Vitamin B6
0.23mg
18%
Vitamin B5
0.87mg
17%
Polyunsaturated fat
1.458g
10%
Copper
0.078mg
9%
Monounsaturated fat
3.315g
8%
Calories
211kcal
79kcal
7%
Magnesium
31mg
7%
Zinc
0.69mg
6%
Vitamin A
36µg
4%
Vitamin B2
0.15mg
0.2mg
4%
Vitamin B3
3.8mg
3.2mg
4%
Folate
17µg
4%
Sodium
76mg
3%
Carbs
0g
4.7g
2%
Calcium
43mg
30mg
1%
Manganese
0.025mg
1%
Protein per 100 calories
11g
17g
N/A
Calories per 10 g protein
89kcal
59kcal
N/A
Weight per 100 calories
47g
127g
N/A
Unsaturated / Saturated Fat ratio
1.1
N/A
Net carbs
0g
4.7g
N/A
Tryptophan
0.265mg
0%
Threonine
1.038mg
0%
Isoleucine
1.092mg
0%
Leucine
1.925mg
0%
Lysine
2.175mg
0%
Methionine
0.701mg
0%
Phenylalanine
0.925mg
0%
Valine
1.22mg
0%
Histidine
0.697mg
0%
Omega-3 - EPA
0.224g
N/A
Omega-3 - DHA
0.504g
N/A
Omega-3 - DPA
0.259g
N/A
Macronutrient Comparison
Macronutrient breakdown side-by-side comparison
2
24%
12%
63%
Protein:
23.69 g
Fats:
12.14 g
Carbs:
0 g
Water:
62.97 g
Other:
1.2 g
3
14%
5%
79%
2%
Protein:
13.5 g
Fats:
0.7 g
Carbs:
4.7 g
Water:
78.8 g
Other:
2.3 g
Contains
more
Protein Protein
+75.5%
Contains
more
Fats Fats
+1634.3%
Contains
more
Carbs Carbs
+∞%
Contains
more
Water Water
+25.1%
Contains
more
Other Other
+91.7%