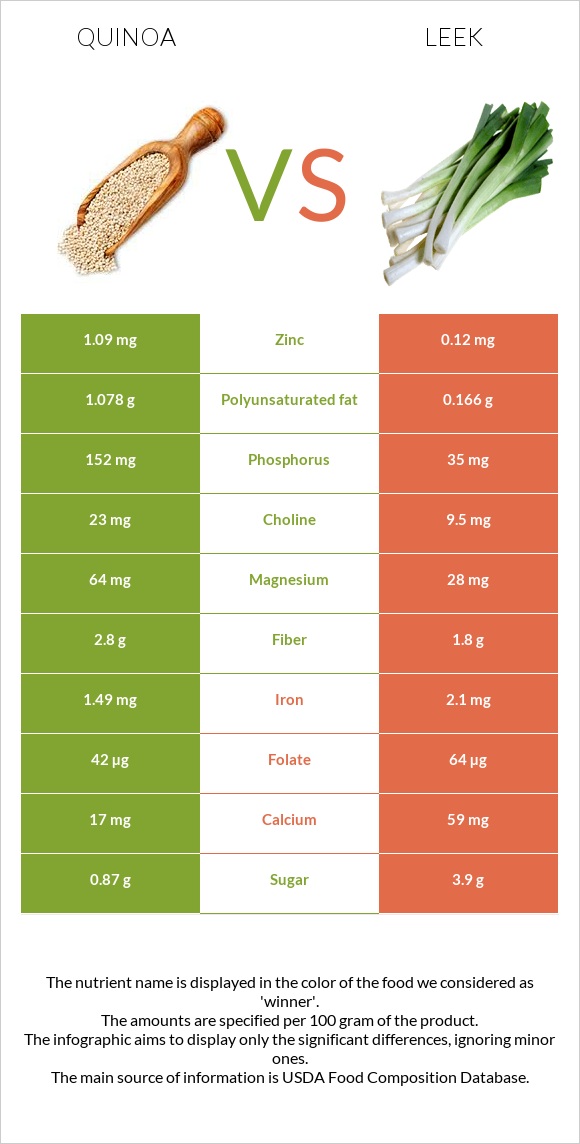
Summary of differences between quinoa and leeks Quinoa has more phosphorus, zinc, magnesium, copper, and manganese; however, leeks are higher in vitamin K, vitamin A, vitamin C, vitamin B6, and iron. Leeks cover your daily need for vitamin K, 39% more than quinoa. Quinoa has 9 times more zinc than leeks. While quinoa has 1.09mg of zinc, leeks have only 0.12mg. The glycemic index of quinoa is higher. These are the specific foods used in this comparison Quinoa, cooked and Leeks, (bulb and lower leaf-portion), raw .
Infographic
Mineral Comparison
Mineral comparison score is based on the number of minerals by which one or the other food is richer. The "coverage" charts below show how much of the daily needs can be covered by 300 grams of the food.
7
100 g
300 g
1 cup - 185g
Magnesium
Magnesium
Calcium
Calcium
Potassium
Potassium
Iron
Iron
Copper
Copper
Zinc
Zinc
Phosphorus
Phosphorus
Sodium
Sodium
Manganese
Manganese
Selenium
Selenium
46%
5.1%
15%
56%
64%
30%
65%
0.91%
82%
15%
2
100 g
300 g
1 slice - 6g 1 cup - 89g 1 leek - 89g
Magnesium
Magnesium
Calcium
Calcium
Potassium
Potassium
Iron
Iron
Copper
Copper
Zinc
Zinc
Phosphorus
Phosphorus
Sodium
Sodium
Manganese
Manganese
Selenium
Selenium
20%
18%
16%
79%
40%
3.3%
15%
2.6%
63%
5.5%
Vitamin Comparison
Vitamin comparison score is based on the number of vitamins by which one or the other food is richer. The "coverage" charts below show how much of the daily needs can be covered by 300 grams of the food.
2
100 g
300 g
1 cup - 185g
Vitamin C
Vit. C
Vitamin D
Vit. D
Vitamin A
Vit. A
Vitamin E
Vit. E
Vitamin B1
Vit. B1
Vitamin B2
Vit. B2
Vitamin B3
Vit. B3
Vitamin B5
Vit. B5
Vitamin B6
Vit. B6
Vitamin B12
Vit. B12
Vitamin K
Vit. K
Folate
Folate
0%
0%
0%
13%
27%
25%
7.7%
0%
28%
0%
0%
32%
7
100 g
300 g
1 slice - 6g 1 cup - 89g 1 leek - 89g
Vitamin C
Vit. C
Vitamin D
Vit. D
Vitamin A
Vit. A
Vitamin E
Vit. E
Vitamin B1
Vit. B1
Vitamin B2
Vit. B2
Vitamin B3
Vit. B3
Vitamin B5
Vit. B5
Vitamin B6
Vit. B6
Vitamin B12
Vit. B12
Vitamin K
Vit. K
Folate
Folate
40%
0%
28%
18%
15%
6.9%
7.5%
8.4%
54%
0%
118%
48%
All nutrients comparison - raw data values
Nutrient
DV% diff.
Vitamin K
0µg
47µg
39%
Phosphorus
152mg
35mg
17%
Vitamin C
0mg
12mg
13%
Magnesium
64mg
28mg
9%
Zinc
1.09mg
0.12mg
9%
Vitamin A
0µg
83µg
9%
Iron
1.49mg
2.1mg
8%
Copper
0.192mg
0.12mg
8%
Vitamin B6
0.123mg
0.233mg
8%
Starch
17.63g
7%
Manganese
0.631mg
0.481mg
7%
Protein
4.4g
1.5g
6%
Vitamin B2
0.11mg
0.03mg
6%
Folate
42µg
64µg
6%
Polyunsaturated fat
1.078g
0.166g
6%
Calcium
17mg
59mg
4%
Fiber
2.8g
1.8g
4%
Vitamin B1
0.107mg
0.06mg
4%
Calories
120kcal
61kcal
3%
Selenium
2.8µg
1µg
3%
Vitamin B5
0.14mg
3%
Fats
1.92g
0.3g
2%
Carbs
21.3g
14.15g
2%
Vitamin E
0.63mg
0.92mg
2%
Choline
23mg
9.5mg
2%
Sodium
7mg
20mg
1%
Saturated fat
0.231g
0.04g
1%
Monounsaturated fat
0.528g
0.004g
1%
Protein per 100 calories
3.7g
2.5g
N/A
Calories per 10 g protein
273kcal
407kcal
N/A
Weight per 100 calories
83g
164g
N/A
Net carbs
18.5g
12.35g
N/A
Potassium
172mg
180mg
0%
Sugar
0.87g
3.9g
N/A
Vitamin B3
0.412mg
0.4mg
0%
Tryptophan
0.052mg
0.012mg
0%
Threonine
0.131mg
0.063mg
0%
Isoleucine
0.157mg
0.052mg
0%
Leucine
0.261mg
0.096mg
0%
Lysine
0.239mg
0.078mg
0%
Methionine
0.096mg
0.018mg
0%
Phenylalanine
0.185mg
0.055mg
0%
Valine
0.185mg
0.056mg
0%
Histidine
0.127mg
0.025mg
0%
Omega-3 - DHA
0.015g
0g
N/A
Macronutrient Comparison
Macronutrient breakdown side-by-side comparison
3
4%
2%
21%
72%
Protein:
4.4 g
Fats:
1.92 g
Carbs:
21.3 g
Water:
71.61 g
Other:
0.77 g
2
14%
83%
Protein:
1.5 g
Fats:
0.3 g
Carbs:
14.15 g
Water:
83 g
Other:
1.05 g
Contains
more
Protein Protein
+193.3%
Contains
more
Fats Fats
+540%
Contains
more
Carbs Carbs
+50.5%
Contains
more
Water Water
+15.9%
Contains
more
Other Other
+36.4%
Fat Type Comparison
Fat type breakdown side-by-side comparison
2
13%
29%
59%
Saturated fat:
Sat. Fat
0.231 g
Monounsaturated fat:
Mono. Fat
0.528 g
Polyunsaturated fat:
Poly. Fat
1.078 g
1
19%
2%
79%
Saturated fat:
Sat. Fat
0.04 g
Monounsaturated fat:
Mono. Fat
0.004 g
Polyunsaturated fat:
Poly. Fat
0.166 g
Contains
more
Mono. Fat Monounsaturated fat
+13100%
Contains
more
Poly. Fat Polyunsaturated fat
+549.4%
Contains
less
Sat. Fat Saturated fat
-82.7%