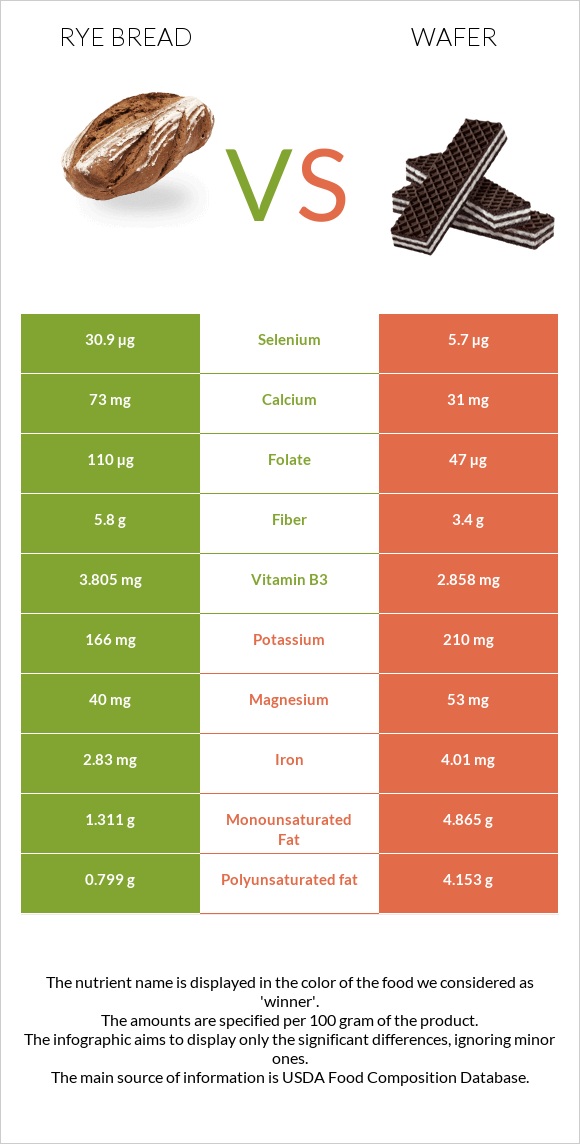
What are the differences between rye bread and wafer? Rye bread is higher in selenium, vitamin B1, folate, fiber, vitamin B3, manganese, and vitamin B2, yet wafer is higher in copper and iron. Rye bread's daily need coverage for selenium is 46% more. Rye bread has 2 times more folate than wafer. While rye bread has 110µg of folate, wafer has only 47µg. The amount of saturated fat in rye bread is lower. We used Bread, rye and Cookies, chocolate wafers types in this article.
Infographic
Mineral Comparison
Mineral comparison score is based on the number of minerals by which one or the other food is richer. The "coverage" charts below show how much of the daily needs can be covered by 300 grams of the food.
3
100 g
300 g
1 slice, snack-size - 7g 1 slice, thin - 25g 1 oz - 28.35g 1 slice, regular - 32g
Magnesium
Magnesium
Calcium
Calcium
Potassium
Potassium
Iron
Iron
Copper
Copper
Zinc
Zinc
Phosphorus
Phosphorus
Sodium
Sodium
Manganese
Manganese
Selenium
Selenium
29%
22%
15%
106%
62%
31%
54%
79%
107%
169%
4
100 g
300 g
1 wafer - 6g 1 oz - 28.35g 1 cup, crumbs - 112g
Magnesium
Magnesium
Calcium
Calcium
Potassium
Potassium
Iron
Iron
Copper
Copper
Zinc
Zinc
Phosphorus
Phosphorus
Sodium
Sodium
Manganese
Manganese
Selenium
Selenium
38%
9.3%
19%
150%
154%
30%
57%
76%
91%
31%
Vitamin Comparison
Vitamin comparison score is based on the number of vitamins by which one or the other food is richer. The "coverage" charts below show how much of the daily needs can be covered by 300 grams of the food.
7
100 g
300 g
1 slice, snack-size - 7g 1 slice, thin - 25g 1 oz - 28.35g 1 slice, regular - 32g
Vitamin C
Vit. C
Vitamin D
Vit. D
Vitamin A
Vit. A
Vitamin E
Vit. E
Vitamin B1
Vit. B1
Vitamin B2
Vit. B2
Vitamin B3
Vit. B3
Vitamin B5
Vit. B5
Vitamin B6
Vit. B6
Vitamin B12
Vit. B12
Vitamin K
Vit. K
Folate
Folate
1.3%
0%
0%
6.6%
109%
77%
71%
26%
17%
0%
3%
83%
4
100 g
300 g
1 wafer - 6g 1 oz - 28.35g 1 cup, crumbs - 112g
Vitamin C
Vit. C
Vitamin D
Vit. D
Vitamin A
Vit. A
Vitamin E
Vit. E
Vitamin B1
Vit. B1
Vitamin B2
Vit. B2
Vitamin B3
Vit. B3
Vitamin B5
Vit. B5
Vitamin B6
Vit. B6
Vitamin B12
Vit. B12
Vitamin K
Vit. K
Folate
Folate
0%
0%
1%
14%
51%
61%
54%
23%
12%
11%
6%
35%
All nutrients comparison - raw data values
Nutrient
DV% diff.
Selenium
30.9µg
5.7µg
46%
Copper
0.186mg
0.463mg
31%
Polyunsaturated fat
0.799g
4.153g
22%
Vitamin B1
0.434mg
0.203mg
19%
Fats
3.3g
14.2g
17%
Folate
110µg
47µg
16%
Saturated fat
0.626g
4.241g
16%
Iron
2.83mg
4.01mg
15%
Fiber
5.8g
3.4g
10%
Calories
259kcal
433kcal
9%
Monounsaturated fat
1.311g
4.865g
9%
Carbs
48.3g
72.7g
8%
Manganese
0.824mg
0.696mg
6%
Vitamin B3
3.805mg
2.858mg
6%
Vitamin B2
0.335mg
0.266mg
5%
Protein
8.5g
6.6g
4%
Calcium
73mg
31mg
4%
Vitamin B12
0µg
0.09µg
4%
Magnesium
40mg
53mg
3%
Vitamin E
0.33mg
0.72mg
3%
Caffeine
0mg
10mg
3%
Vitamin B6
0.075mg
0.051mg
2%
Cholesterol
0mg
2mg
1%
Potassium
166mg
210mg
1%
Phosphorus
125mg
132mg
1%
Sodium
603mg
580mg
1%
Vitamin B5
0.44mg
0.381mg
1%
Vitamin K
1.2µg
2.4µg
1%
Protein per 100 calories
3.3g
1.5g
N/A
Calories per 10 g protein
305kcal
656kcal
N/A
Weight per 100 calories
39g
23g
N/A
Unsaturated / Saturated Fat ratio
3.4
2.1
N/A
Vitamin C
0.4mg
0mg
0%
Net carbs
42.5g
69.3g
N/A
Sugar
3.85g
37.43g
N/A
Zinc
1.14mg
1.09mg
0%
Vitamin A
0µg
3µg
0%
Choline
14.6mg
14.3mg
0%
Tryptophan
0.096mg
0.096mg
0%
Threonine
0.255mg
0.22mg
0%
Isoleucine
0.319mg
0.261mg
0%
Leucine
0.579mg
0.447mg
0%
Lysine
0.233mg
0.281mg
0%
Methionine
0.139mg
0.105mg
0%
Phenylalanine
0.411mg
0.308mg
0%
Valine
0.379mg
0.323mg
0%
Histidine
0.182mg
0.128mg
0%
Omega-3 - EPA
0g
0.003g
N/A
Omega-3 - DHA
0g
0.002g
N/A
Macronutrient Comparison
Macronutrient breakdown side-by-side comparison
3
9%
3%
48%
37%
3%
Protein:
8.5 g
Fats:
3.3 g
Carbs:
48.3 g
Water:
37.3 g
Other:
2.6 g
2
7%
14%
73%
5%
2%
Protein:
6.6 g
Fats:
14.2 g
Carbs:
72.7 g
Water:
4.5 g
Other:
2 g
Contains
more
Protein Protein
+28.8%
Contains
more
Water Water
+728.9%
Contains
more
Other Other
+30%
Contains
more
Fats Fats
+330.3%
Contains
more
Carbs Carbs
+50.5%
Fat Type Comparison
Fat type breakdown side-by-side comparison
1
23%
48%
29%
Saturated fat:
Sat. Fat
0.626 g
Monounsaturated fat:
Mono. Fat
1.311 g
Polyunsaturated fat:
Poly. Fat
0.799 g
2
32%
37%
31%
Saturated fat:
Sat. Fat
4.241 g
Monounsaturated fat:
Mono. Fat
4.865 g
Polyunsaturated fat:
Poly. Fat
4.153 g
Contains
less
Sat. Fat Saturated fat
-85.2%
Contains
more
Mono. Fat Monounsaturated fat
+271.1%
Contains
more
Poly. Fat Polyunsaturated fat
+419.8%