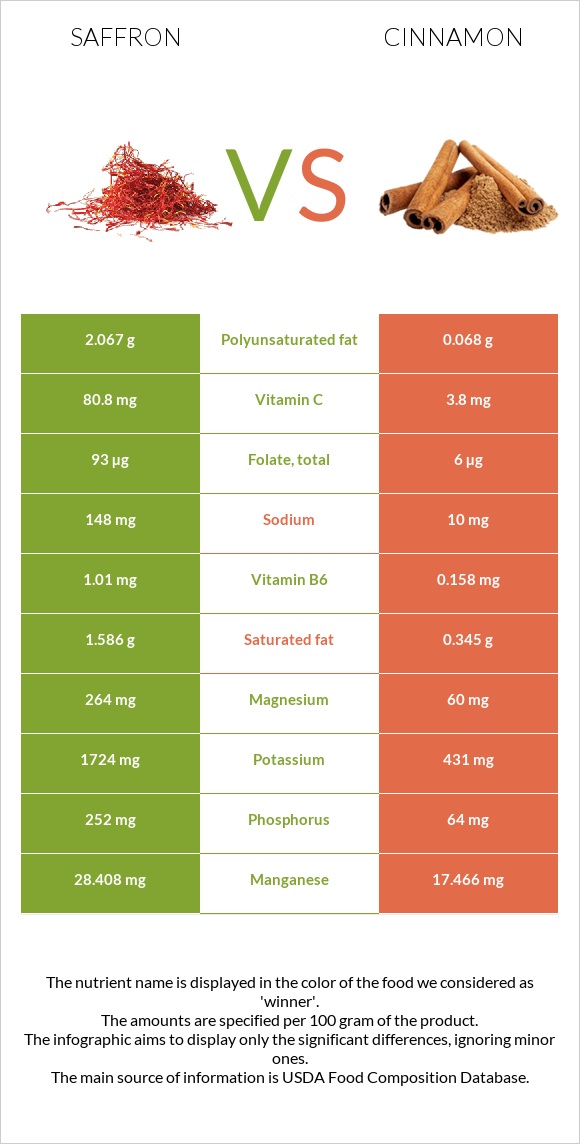
What are the differences between saffron and cinnamon? Saffron is higher in manganese, vitamin C, vitamin B6, magnesium, potassium, iron, phosphorus, and folate, yet cinnamon is higher in fiber and calcium. Saffron's daily need coverage for manganese is 476% more. Saffron has 21 times more vitamin C than cinnamon. While saffron has 80.8mg of vitamin C, cinnamon has only 3.8mg. We used Spices, saffron and Spices, cinnamon, ground types in this article.
Infographic
Mineral Comparison
Mineral comparison score is based on the number of minerals by which one or the other food is richer. The "coverage" charts below show how much of the daily needs can be covered by 300 grams of the food.
6
100 g
300 g
0.25 tsp - 0.5g 1 tbsp - 2.1g
Magnesium
Magnesium
Calcium
Calcium
Potassium
Potassium
Iron
Iron
Copper
Copper
Zinc
Zinc
Phosphorus
Phosphorus
Sodium
Sodium
Manganese
Manganese
Selenium
Selenium
189%
33%
152%
416%
109%
30%
108%
19%
3705%
31%
3
100 g
300 g
0.25 tsp - 0.5g 1 tbsp - 7.8g
Magnesium
Magnesium
Calcium
Calcium
Potassium
Potassium
Iron
Iron
Copper
Copper
Zinc
Zinc
Phosphorus
Phosphorus
Sodium
Sodium
Manganese
Manganese
Selenium
Selenium
43%
301%
38%
312%
113%
50%
27%
1.3%
2278%
17%
Vitamin Comparison
Vitamin comparison score is based on the number of vitamins by which one or the other food is richer. The "coverage" charts below show how much of the daily needs can be covered by 300 grams of the food.
6
100 g
300 g
0.25 tsp - 0.5g 1 tbsp - 2.1g
Vitamin C
Vit. C
Vitamin D
Vit. D
Vitamin A
Vit. A
Vitamin E
Vit. E
Vitamin B1
Vit. B1
Vitamin B2
Vit. B2
Vitamin B3
Vit. B3
Vitamin B5
Vit. B5
Vitamin B6
Vit. B6
Vitamin B12
Vit. B12
Vitamin K
Vit. K
Folate
Folate
269%
0%
9%
0%
29%
62%
27%
0%
233%
0%
0%
70%
3
100 g
300 g
0.25 tsp - 0.5g 1 tbsp - 7.8g
Vitamin C
Vit. C
Vitamin D
Vit. D
Vitamin A
Vit. A
Vitamin E
Vit. E
Vitamin B1
Vit. B1
Vitamin B2
Vit. B2
Vitamin B3
Vit. B3
Vitamin B5
Vit. B5
Vitamin B6
Vit. B6
Vitamin B12
Vit. B12
Vitamin K
Vit. K
Folate
Folate
13%
0%
5%
46%
5.5%
9.5%
25%
21%
36%
0%
78%
4.5%
All nutrients comparison - raw data values
Nutrient
DV% diff.
Manganese
28.408mg
17.466mg
476%
Fiber
3.9g
53.1g
197%
Calcium
111mg
1002mg
89%
Vitamin C
80.8mg
3.8mg
86%
Vitamin B6
1.01mg
0.158mg
66%
Magnesium
264mg
60mg
49%
Potassium
1724mg
431mg
38%
Iron
11.1mg
8.32mg
35%
Phosphorus
252mg
64mg
27%
Vitamin K
31.2µg
26%
Folate
93µg
6µg
22%
Vitamin B2
0.267mg
0.041mg
17%
Protein
11.43g
3.99g
15%
Vitamin E
2.32mg
15%
Polyunsaturated fat
2.067g
0.068g
13%
Vitamin B1
0.115mg
0.022mg
8%
Fats
5.85g
1.24g
7%
Zinc
1.09mg
1.83mg
7%
Vitamin B5
0.358mg
7%
Sodium
148mg
10mg
6%
Saturated fat
1.586g
0.345g
6%
Carbs
65.37g
80.59g
5%
Selenium
5.6µg
3.1µg
5%
Calories
310kcal
247kcal
3%
Choline
11mg
2%
Copper
0.328mg
0.339mg
1%
Vitamin A
27µg
15µg
1%
Vitamin B3
1.46mg
1.332mg
1%
Fructose
1.11g
1%
Protein per 100 calories
3.7g
1.6g
N/A
Calories per 10 g protein
271kcal
619kcal
N/A
Weight per 100 calories
32g
40g
N/A
Unsaturated / Saturated Fat ratio
1.6
0.91
N/A
Net carbs
61.47g
27.49g
N/A
Sugar
2.17g
N/A
Monounsaturated fat
0.429g
0.246g
0%
Tryptophan
0.049mg
0%
Threonine
0.136mg
0%
Isoleucine
0.146mg
0%
Leucine
0.253mg
0%
Lysine
0.243mg
0%
Methionine
0.078mg
0%
Phenylalanine
0.146mg
0%
Valine
0.224mg
0%
Histidine
0.117mg
0%
Omega-3 - ALA
0.011g
N/A
Omega-3 - DPA
0.006g
0g
N/A
Macronutrient Comparison
Macronutrient breakdown side-by-side comparison
4
11%
6%
65%
12%
5%
Protein:
11.43 g
Fats:
5.85 g
Carbs:
65.37 g
Water:
11.9 g
Other:
5.45 g
1
4%
81%
11%
4%
Protein:
3.99 g
Fats:
1.24 g
Carbs:
80.59 g
Water:
10.58 g
Other:
3.6 g
Contains
more
Protein Protein
+186.5%
Contains
more
Fats Fats
+371.8%
Contains
more
Water Water
+12.5%
Contains
more
Other Other
+51.4%
Contains
more
Carbs Carbs
+23.3%
Fat Type Comparison
Fat type breakdown side-by-side comparison
2
39%
11%
51%
Saturated fat:
Sat. Fat
1.586 g
Monounsaturated fat:
Mono. Fat
0.429 g
Polyunsaturated fat:
Poly. Fat
2.067 g
1
52%
37%
10%
Saturated fat:
Sat. Fat
0.345 g
Monounsaturated fat:
Mono. Fat
0.246 g
Polyunsaturated fat:
Poly. Fat
0.068 g
Contains
more
Mono. Fat Monounsaturated fat
+74.4%
Contains
more
Poly. Fat Polyunsaturated fat
+2939.7%
Contains
less
Sat. Fat Saturated fat
-78.2%