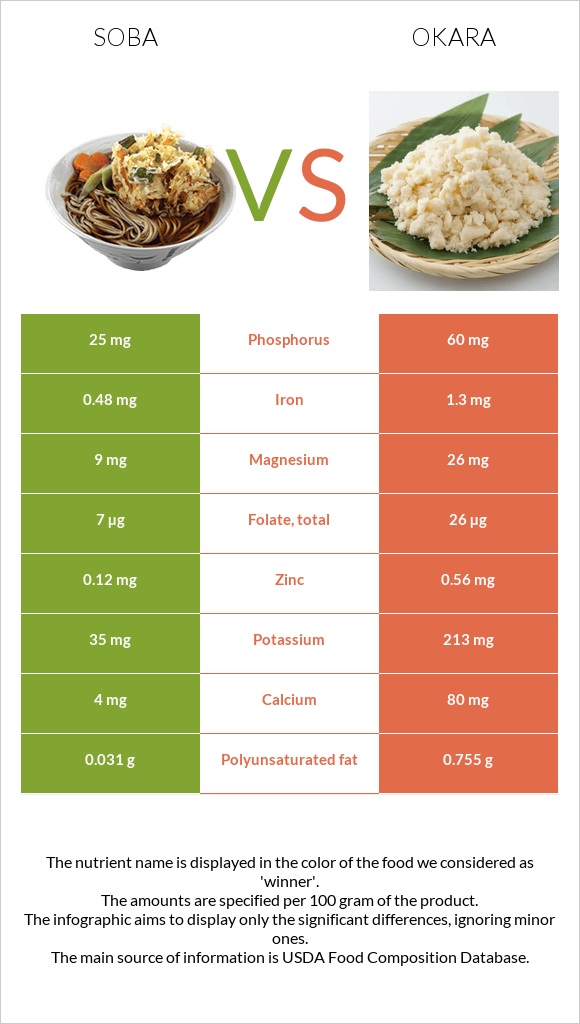
A recap on the differences between soba and okara Soba has more vitamin B1; however, okara is higher in copper, iron, calcium, vitamin B6, potassium, and phosphorus. Okara covers your daily copper needs 21% more than soba. Okara contains 5 times less vitamin B1 than soba. Soba contains 0.094mg of vitamin B1, while okara contains 0.02mg. Food varieties used in this article are Noodles, japanese, soba, cooked and Okara .
Infographic
Mineral Comparison
Mineral comparison score is based on the number of minerals by which one or the other food is richer. The "coverage" charts below show how much of the daily needs can be covered by 300 grams of the food.
0
100 g
300 g
1 cup - 114g
Magnesium
Magnesium
Calcium
Calcium
Potassium
Potassium
Iron
Iron
Copper
Copper
Zinc
Zinc
Phosphorus
Phosphorus
Sodium
Sodium
Manganese
Manganese
Selenium
Selenium
6.4%
1.2%
3.1%
18%
2.7%
3.3%
11%
7.8%
49%
0%
9
100 g
300 g
1 cup - 122g
Magnesium
Magnesium
Calcium
Calcium
Potassium
Potassium
Iron
Iron
Copper
Copper
Zinc
Zinc
Phosphorus
Phosphorus
Sodium
Sodium
Manganese
Manganese
Selenium
Selenium
19%
24%
19%
49%
67%
15%
26%
1.2%
53%
58%
Vitamin Comparison
Vitamin comparison score is based on the number of vitamins by which one or the other food is richer. The "coverage" charts below show how much of the daily needs can be covered by 300 grams of the food.
4
100 g
300 g
1 cup - 114g
Vitamin C
Vit. C
Vitamin D
Vit. D
Vitamin A
Vit. A
Vitamin E
Vit. E
Vitamin B1
Vit. B1
Vitamin B2
Vit. B2
Vitamin B3
Vit. B3
Vitamin B5
Vit. B5
Vitamin B6
Vit. B6
Vitamin B12
Vit. B12
Vitamin K
Vit. K
Folate
Folate
0%
0%
0%
0%
24%
6%
9.6%
14%
9.2%
0%
0%
5.3%
2
100 g
300 g
1 cup - 122g
Vitamin C
Vit. C
Vitamin D
Vit. D
Vitamin A
Vit. A
Vitamin E
Vit. E
Vitamin B1
Vit. B1
Vitamin B2
Vit. B2
Vitamin B3
Vit. B3
Vitamin B5
Vit. B5
Vitamin B6
Vit. B6
Vitamin B12
Vit. B12
Vitamin K
Vit. K
Folate
Folate
0%
0%
0%
0%
5%
4.6%
1.9%
5.3%
27%
0%
0%
20%
All nutrients comparison - raw data values
Nutrient
DV% diff.
Copper
0.008mg
0.2mg
21%
Selenium
10.6µg
19%
Iron
0.48mg
1.3mg
10%
Calcium
4mg
80mg
8%
Vitamin B1
0.094mg
0.02mg
6%
Vitamin B6
0.04mg
0.115mg
6%
Potassium
35mg
213mg
5%
Phosphorus
25mg
60mg
5%
Folate
7µg
26µg
5%
Polyunsaturated fat
0.031g
0.755g
5%
Magnesium
9mg
26mg
4%
Zinc
0.12mg
0.56mg
4%
Protein
5.06g
3.52g
3%
Fats
0.1g
1.73g
3%
Carbs
21.44g
12.23g
3%
Vitamin B3
0.51mg
0.1mg
3%
Vitamin B5
0.235mg
0.088mg
3%
Sodium
60mg
9mg
2%
Calories
99kcal
76kcal
1%
Manganese
0.374mg
0.404mg
1%
Saturated fat
0.019g
0.193g
1%
Monounsaturated fat
0.026g
0.295g
1%
Protein per 100 calories
5.1g
4.6g
N/A
Calories per 10 g protein
196kcal
216kcal
N/A
Weight per 100 calories
101g
132g
N/A
Net carbs
21.44g
12.23g
N/A
Vitamin B2
0.026mg
0.02mg
0%
Tryptophan
0.072mg
0.05mg
0%
Threonine
0.177mg
0.131mg
0%
Isoleucine
0.195mg
0.159mg
0%
Leucine
0.33mg
0.244mg
0%
Lysine
0.214mg
0.212mg
0%
Methionine
0.072mg
0.041mg
0%
Phenylalanine
0.217mg
0.157mg
0%
Valine
0.249mg
0.162mg
0%
Histidine
0.119mg
0.093mg
0%
Macronutrient Comparison
Macronutrient breakdown side-by-side comparison
2
5%
21%
73%
Protein:
5.06 g
Fats:
0.1 g
Carbs:
21.44 g
Water:
73.01 g
Other:
0.39 g
3
4%
2%
12%
82%
Protein:
3.52 g
Fats:
1.73 g
Carbs:
12.23 g
Water:
81.64 g
Other:
0.88 g
Contains
more
Protein Protein
+43.8%
Contains
more
Carbs Carbs
+75.3%
Contains
more
Fats Fats
+1630%
Contains
more
Water Water
+11.8%
Contains
more
Other Other
+125.6%
Fat Type Comparison
Fat type breakdown side-by-side comparison
1
25%
34%
41%
Saturated fat:
Sat. Fat
0.019 g
Monounsaturated fat:
Mono. Fat
0.026 g
Polyunsaturated fat:
Poly. Fat
0.031 g
2
16%
24%
61%
Saturated fat:
Sat. Fat
0.193 g
Monounsaturated fat:
Mono. Fat
0.295 g
Polyunsaturated fat:
Poly. Fat
0.755 g
Contains
less
Sat. Fat Saturated fat
-90.2%
Contains
more
Mono. Fat Monounsaturated fat
+1034.6%
Contains
more
Poly. Fat Polyunsaturated fat
+2335.5%