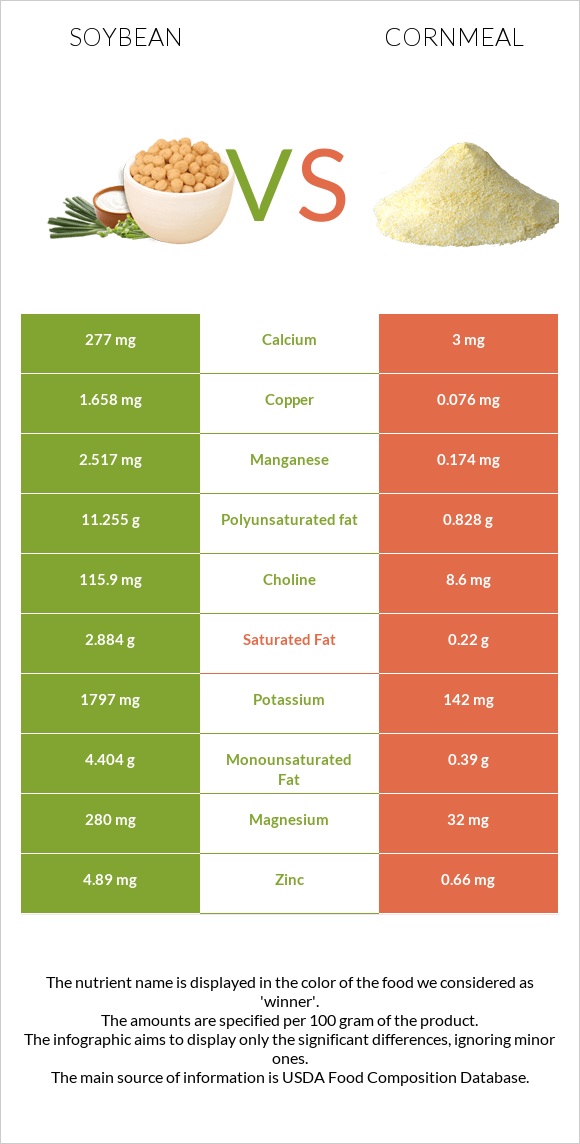
Differences between soybeans and cornmeal Soybeans have more copper, manganese, phosphorus, vitamin K, magnesium, potassium, and calcium, while cornmeal has more folate, vitamin B1, and vitamin B3. Cornmeal's daily need coverage for folate is 39% higher. Soybeans have a lower glycemic index. The glycemic index of soybeans is 14, while the glycemic index of cornmeal is 68. The food types used in this comparison are Soybeans, mature cooked, boiled, without salt and Cornmeal, degermed, enriched, yellow .
Infographic
Mineral Comparison
Mineral comparison score is based on the number of minerals by which one or the other food is richer. The "coverage" charts below show how much of the daily needs can be covered by 300 grams of the food.
9
100 g
300 g
1 tbsp - 10.7g 1 cup - 172g
Magnesium
Magnesium
Calcium
Calcium
Potassium
Potassium
Iron
Iron
Copper
Copper
Zinc
Zinc
Phosphorus
Phosphorus
Sodium
Sodium
Manganese
Manganese
Selenium
Selenium
61%
31%
45%
193%
136%
31%
105%
0.13%
107%
40%
1
100 g
300 g
1 cup - 157g
Magnesium
Magnesium
Calcium
Calcium
Potassium
Potassium
Iron
Iron
Copper
Copper
Zinc
Zinc
Phosphorus
Phosphorus
Sodium
Sodium
Manganese
Manganese
Selenium
Selenium
23%
0.9%
13%
164%
25%
18%
42%
0.91%
23%
57%
Vitamin Comparison
Vitamin comparison score is based on the number of vitamins by which one or the other food is richer. The "coverage" charts below show how much of the daily needs can be covered by 300 grams of the food.
4
100 g
300 g
1 tbsp - 10.7g 1 cup - 172g
Vitamin C
Vit. C
Vitamin D
Vit. D
Vitamin A
Vit. A
Vitamin E
Vit. E
Vitamin B1
Vit. B1
Vitamin B2
Vit. B2
Vitamin B3
Vit. B3
Vitamin B5
Vit. B5
Vitamin B6
Vit. B6
Vitamin B12
Vit. B12
Vitamin K
Vit. K
Folate
Folate
5.7%
0%
0%
7%
39%
66%
7.5%
11%
54%
0%
48%
41%
6
100 g
300 g
1 cup - 157g
Vitamin C
Vit. C
Vitamin D
Vit. D
Vitamin A
Vit. A
Vitamin E
Vit. E
Vitamin B1
Vit. B1
Vitamin B2
Vit. B2
Vitamin B3
Vit. B3
Vitamin B5
Vit. B5
Vitamin B6
Vit. B6
Vitamin B12
Vit. B12
Vitamin K
Vit. K
Folate
Folate
0%
0%
3.7%
2.4%
138%
88%
93%
14%
42%
0%
0%
157%
All nutrients comparison - raw data values
Nutrient
DV% diff.
Folate
54µg
209µg
39%
Copper
0.407mg
0.076mg
37%
Vitamin B1
0.155mg
0.551mg
33%
Starch
73.3g
30%
Vitamin B3
0.399mg
4.968mg
29%
Manganese
0.824mg
0.174mg
28%
Polyunsaturated fat
5.064g
0.828g
28%
Carbs
8.36g
79.45g
24%
Protein
18.21g
7.11g
22%
Phosphorus
245mg
99mg
21%
Vitamin K
19.2µg
0µg
16%
Magnesium
86mg
32mg
13%
Fats
8.97g
1.75g
11%
Potassium
515mg
142mg
11%
Calories
172kcal
370kcal
10%
Calcium
102mg
3mg
10%
Iron
5.14mg
4.36mg
10%
Fiber
6g
3.9g
8%
Vitamin B2
0.285mg
0.382mg
7%
Choline
47.5mg
8.6mg
7%
Selenium
7.3µg
10.5µg
6%
Saturated fat
1.297g
0.22g
5%
Zinc
1.15mg
0.66mg
4%
Vitamin B6
0.234mg
0.182mg
4%
Monounsaturated fat
1.981g
0.39g
4%
Vitamin C
1.7mg
0mg
2%
Vitamin E
0.35mg
0.12mg
2%
Vitamin A
0µg
11µg
1%
Vitamin B5
0.179mg
0.24mg
1%
Protein per 100 calories
11g
1.9g
N/A
Calories per 10 g protein
94kcal
520kcal
N/A
Weight per 100 calories
58g
27g
N/A
Unsaturated / Saturated Fat ratio
5.4
5.5
N/A
Net carbs
2.36g
75.55g
N/A
Sugar
3g
1.61g
N/A
Sodium
1mg
7mg
0%
Tryptophan
0.242mg
0.038mg
0%
Threonine
0.723mg
0.172mg
0%
Isoleucine
0.807mg
0.242mg
0%
Leucine
1.355mg
1.006mg
0%
Lysine
1.108mg
0.105mg
0%
Methionine
0.224mg
0.162mg
0%
Phenylalanine
0.869mg
0.366mg
0%
Valine
0.831mg
0.337mg
0%
Histidine
0.449mg
0.172mg
0%
Fructose
0.17g
0%
Macronutrient Comparison
Macronutrient breakdown side-by-side comparison
4
18%
9%
8%
63%
2%
Protein:
18.21 g
Fats:
8.97 g
Carbs:
8.36 g
Water:
62.55 g
Other:
1.91 g
1
7%
2%
79%
11%
Protein:
7.11 g
Fats:
1.75 g
Carbs:
79.45 g
Water:
11.18 g
Other:
0.51 g
Contains
more
Protein Protein
+156.1%
Contains
more
Fats Fats
+412.6%
Contains
more
Water Water
+459.5%
Contains
more
Other Other
+274.5%
Contains
more
Carbs Carbs
+850.4%
Fat Type Comparison
Fat type breakdown side-by-side comparison
2
16%
24%
61%
Saturated fat:
Sat. Fat
1.297 g
Monounsaturated fat:
Mono. Fat
1.981 g
Polyunsaturated fat:
Poly. Fat
5.064 g
1
15%
27%
58%
Saturated fat:
Sat. Fat
0.22 g
Monounsaturated fat:
Mono. Fat
0.39 g
Polyunsaturated fat:
Poly. Fat
0.828 g
Contains
more
Mono. Fat Monounsaturated fat
+407.9%
Contains
more
Poly. Fat Polyunsaturated fat
+511.6%
Contains
less
Sat. Fat Saturated fat
-83%