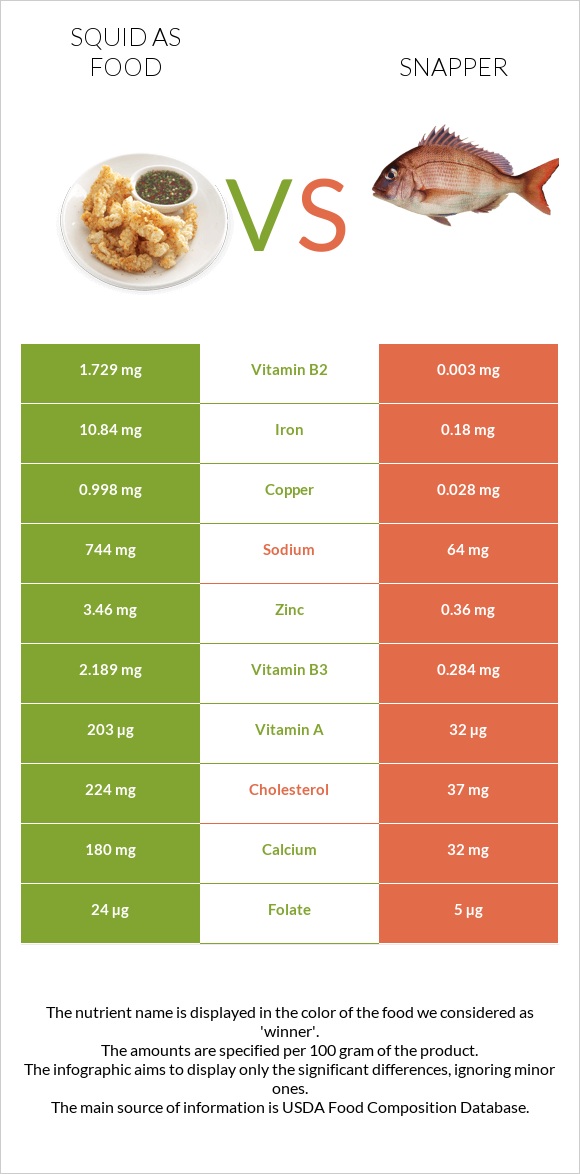
Differences between squid and snapper Squid has more vitamin B2, iron, copper, vitamin B12, selenium, phosphorus, and zinc, while snapper has more vitamin B6. Squid's daily need coverage for vitamin B2 is 133% higher. Snapper contains 45 times less iron than squid. Squid contains 10.84mg of iron, while snapper contains 0.24mg. The amount of sodium in snapper is lower. The food types used in this comparison are Mollusks, cuttlefish, mixed species, cooked, moist heat and Fish, snapper, mixed species, cooked, dry heat .
Infographic
Mineral Comparison
Mineral comparison score is based on the number of minerals by which one or the other food is richer. The "coverage" charts below show how much of the daily needs can be covered by 300 grams of the food.
9
100 g
300 g
3 oz - 85g
Magnesium
Magnesium
Calcium
Calcium
Potassium
Potassium
Iron
Iron
Copper
Copper
Zinc
Zinc
Phosphorus
Phosphorus
Sodium
Sodium
Manganese
Manganese
Selenium
Selenium
43%
54%
56%
407%
333%
94%
249%
97%
27%
489%
1
100 g
300 g
3 oz - 85g 1 fillet - 170g
Magnesium
Magnesium
Calcium
Calcium
Potassium
Potassium
Iron
Iron
Copper
Copper
Zinc
Zinc
Phosphorus
Phosphorus
Sodium
Sodium
Manganese
Manganese
Selenium
Selenium
26%
12%
46%
9%
15%
12%
86%
7.4%
2.2%
267%
Vitamin Comparison
Vitamin comparison score is based on the number of vitamins by which one or the other food is richer. The "coverage" charts below show how much of the daily needs can be covered by 300 grams of the food.
6
100 g
300 g
3 oz - 85g
Vitamin C
Vit. C
Vitamin D
Vit. D
Vitamin A
Vit. A
Vitamin E
Vit. E
Vitamin B1
Vit. B1
Vitamin B2
Vit. B2
Vitamin B3
Vit. B3
Vitamin B5
Vit. B5
Vitamin B6
Vit. B6
Vitamin B12
Vit. B12
Vitamin K
Vit. K
Folate
Folate
28%
0%
68%
0%
4.3%
399%
41%
54%
62%
675%
0%
18%
2
100 g
300 g
3 oz - 85g 1 fillet - 170g
Vitamin C
Vit. C
Vitamin D
Vit. D
Vitamin A
Vit. A
Vitamin E
Vit. E
Vitamin B1
Vit. B1
Vitamin B2
Vit. B2
Vitamin B3
Vit. B3
Vitamin B5
Vit. B5
Vitamin B6
Vit. B6
Vitamin B12
Vit. B12
Vitamin K
Vit. K
Folate
Folate
5.3%
0%
12%
0%
13%
0.92%
6.5%
52%
106%
438%
0%
4.5%
All nutrients comparison - raw data values
Nutrient
DV% diff.
Iron
10.84mg
0.24mg
133%
Vitamin B2
1.729mg
0.004mg
133%
Copper
0.998mg
0.046mg
106%
Vitamin B12
5.4µg
3.5µg
79%
Selenium
89.6µg
49µg
74%
Cholesterol
224mg
47mg
59%
Phosphorus
580mg
201mg
54%
Sodium
744mg
57mg
30%
Zinc
3.46mg
0.44mg
27%
Vitamin A
203µg
35µg
19%
Vitamin B6
0.27mg
0.46mg
15%
Calcium
180mg
40mg
14%
Protein
32.48g
26.3g
12%
Vitamin B3
2.189mg
0.346mg
12%
Vitamin C
8.5mg
1.6mg
8%
Manganese
0.209mg
0.017mg
8%
Magnesium
60mg
37mg
5%
Folate
24µg
6µg
5%
Potassium
637mg
522mg
3%
Vitamin B1
0.017mg
0.053mg
3%
Calories
158kcal
128kcal
2%
Polyunsaturated fat
0.268g
0.588g
2%
Carbs
1.64g
0g
1%
Vitamin B5
0.9mg
0.87mg
1%
Saturated fat
0.236g
0.365g
1%
Protein per 100 calories
21g
21g
N/A
Calories per 10 g protein
49kcal
49kcal
N/A
Weight per 100 calories
63g
78g
N/A
Fats
1.4g
1.72g
0%
Net carbs
1.64g
0g
N/A
Monounsaturated fat
0.162g
0.322g
0%
Tryptophan
0.364mg
0.294mg
0%
Threonine
1.398mg
1.153mg
0%
Isoleucine
1.414mg
1.212mg
0%
Leucine
2.287mg
2.137mg
0%
Lysine
2.427mg
2.415mg
0%
Methionine
0.733mg
0.778mg
0%
Phenylalanine
1.164mg
1.027mg
0%
Valine
1.419mg
1.355mg
0%
Histidine
0.624mg
0.774mg
0%
Omega-3 - EPA
0.078g
0.048g
N/A
Omega-3 - DHA
0.132g
0.273g
N/A
Omega-3 - DPA
0.012g
0.022g
N/A
Macronutrient Comparison
Macronutrient breakdown side-by-side comparison
3
32%
61%
3%
Protein:
32.48 g
Fats:
1.4 g
Carbs:
1.64 g
Water:
61.12 g
Other:
3.36 g
2
26%
2%
70%
Protein:
26.3 g
Fats:
1.72 g
Carbs:
0 g
Water:
70.35 g
Other:
1.63 g
Contains
more
Protein Protein
+23.5%
Contains
more
Carbs Carbs
+∞%
Contains
more
Other Other
+106.1%
Contains
more
Fats Fats
+22.9%
Contains
more
Water Water
+15.1%
Fat Type Comparison
Fat type breakdown side-by-side comparison
1
35%
24%
40%
Saturated fat:
Sat. Fat
0.236 g
Monounsaturated fat:
Mono. Fat
0.162 g
Polyunsaturated fat:
Poly. Fat
0.268 g
2
29%
25%
46%
Saturated fat:
Sat. Fat
0.365 g
Monounsaturated fat:
Mono. Fat
0.322 g
Polyunsaturated fat:
Poly. Fat
0.588 g
Contains
less
Sat. Fat Saturated fat
-35.3%
Contains
more
Mono. Fat Monounsaturated fat
+98.8%
Contains
more
Poly. Fat Polyunsaturated fat
+119.4%