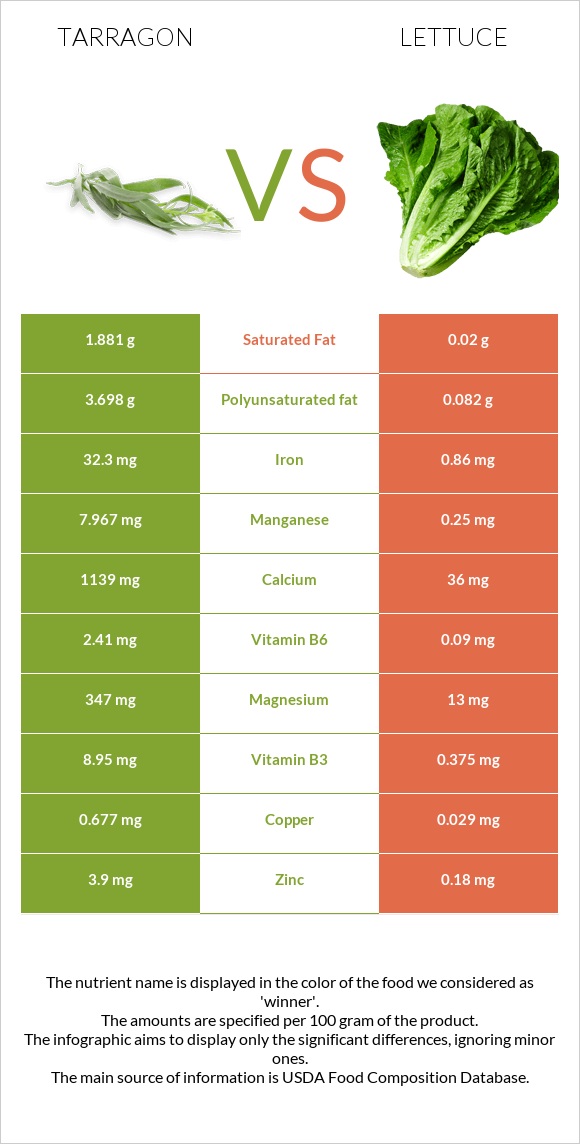
The main differences between tarragon and lettuce Tarragon has more iron, manganese, vitamin B6, calcium, vitamin B2, potassium, magnesium, copper, and folate; however, lettuce has more vitamin A. Daily need coverage for iron for tarragon is 393% higher. Lettuce has 32 times less manganese than tarragon. Tarragon has 7.967mg of manganese, while lettuce has 0.25mg. Lettuce has a higher glycemic index than tarragon. Food types used in this article are Spices, tarragon, dried and Lettuce, green leaf, raw .
Infographic
Mineral Comparison
Mineral comparison score is based on the number of minerals by which one or the other food is richer. The "coverage" charts below show how much of the daily needs can be covered by 300 grams of the food.
9
100 g
300 g
0.25 tsp - 0.5g 1 tsp, ground - 1.6g 1 tbsp, leaves - 1.8g 1 tbsp, ground - 4.8g
Magnesium
Magnesium
Calcium
Calcium
Potassium
Potassium
Iron
Iron
Copper
Copper
Zinc
Zinc
Phosphorus
Phosphorus
Sodium
Sodium
Manganese
Manganese
Selenium
Selenium
248%
342%
266%
1211%
226%
106%
134%
8.1%
1039%
24%
1
100 g
300 g
1 leaf inner - 4.8g 1 leaf outer - 24g 1 cup shredded - 36g 1 head - 360g
Magnesium
Magnesium
Calcium
Calcium
Potassium
Potassium
Iron
Iron
Copper
Copper
Zinc
Zinc
Phosphorus
Phosphorus
Sodium
Sodium
Manganese
Manganese
Selenium
Selenium
9.3%
11%
17%
32%
9.7%
4.9%
12%
3.7%
33%
3.3%
Vitamin Comparison
Vitamin comparison score is based on the number of vitamins by which one or the other food is richer. The "coverage" charts below show how much of the daily needs can be covered by 300 grams of the food.
6
100 g
300 g
0.25 tsp - 0.5g 1 tsp, ground - 1.6g 1 tbsp, leaves - 1.8g 1 tbsp, ground - 4.8g
Vitamin C
Vit. C
Vitamin D
Vit. D
Vitamin A
Vit. A
Vitamin E
Vit. E
Vitamin B1
Vit. B1
Vitamin B2
Vit. B2
Vitamin B3
Vit. B3
Vitamin B5
Vit. B5
Vitamin B6
Vit. B6
Vitamin B12
Vit. B12
Vitamin K
Vit. K
Folate
Folate
167%
0%
70%
0%
63%
309%
168%
0%
556%
0%
0%
206%
4
100 g
300 g
1 leaf inner - 4.8g 1 leaf outer - 24g 1 cup shredded - 36g 1 head - 360g
Vitamin C
Vit. C
Vitamin D
Vit. D
Vitamin A
Vit. A
Vitamin E
Vit. E
Vitamin B1
Vit. B1
Vitamin B2
Vit. B2
Vitamin B3
Vit. B3
Vitamin B5
Vit. B5
Vitamin B6
Vit. B6
Vitamin B12
Vit. B12
Vitamin K
Vit. K
Folate
Folate
31%
0%
123%
4.4%
18%
18%
7%
8%
21%
0%
316%
29%
All nutrients comparison - raw data values
Nutrient
DV% diff.
Iron
32.3mg
0.86mg
393%
Manganese
7.967mg
0.25mg
336%
Vitamin B6
2.41mg
0.09mg
178%
Calcium
1139mg
36mg
110%
Vitamin K
126.3µg
105%
Vitamin B2
1.339mg
0.08mg
97%
Potassium
3020mg
194mg
83%
Magnesium
347mg
13mg
80%
Copper
0.677mg
0.029mg
72%
Folate
274µg
38µg
59%
Vitamin B3
8.95mg
0.375mg
54%
Vitamin C
50mg
9.2mg
45%
Protein
22.77g
1.36g
43%
Phosphorus
313mg
29mg
41%
Zinc
3.9mg
0.18mg
34%
Fiber
7.4g
1.3g
24%
Polyunsaturated fat
3.698g
0.082g
24%
Vitamin A
210µg
370µg
18%
Carbs
50.22g
2.87g
16%
Vitamin B1
0.251mg
0.07mg
15%
Calories
295kcal
15kcal
14%
Fats
7.24g
0.15g
11%
Saturated fat
1.881g
0.02g
8%
Selenium
4.4µg
0.6µg
7%
Vitamin B5
0.134mg
3%
Choline
13.6mg
2%
Sodium
62mg
28mg
1%
Vitamin E
0.22mg
1%
Monounsaturated fat
0.474g
0.006g
1%
Fructose
0.43g
1%
Protein per 100 calories
7.7g
9.1g
N/A
Calories per 10 g protein
130kcal
110kcal
N/A
Weight per 100 calories
34g
667g
N/A
Unsaturated / Saturated Fat ratio
2.2
4.4
N/A
Net carbs
42.82g
1.57g
N/A
Sugar
0.78g
N/A
Tryptophan
0.009mg
0%
Threonine
0.059mg
0%
Isoleucine
0.084mg
0%
Leucine
0.079mg
0%
Lysine
0.084mg
0%
Methionine
0.016mg
0%
Phenylalanine
0.055mg
0%
Valine
0.07mg
0%
Histidine
0.022mg
0%
Macronutrient Comparison
Macronutrient breakdown side-by-side comparison
4
23%
7%
50%
8%
12%
Protein:
22.77 g
Fats:
7.24 g
Carbs:
50.22 g
Water:
7.74 g
Other:
12.03 g
1
3%
95%
Protein:
1.36 g
Fats:
0.15 g
Carbs:
2.87 g
Water:
94.98 g
Other:
0.64 g
Contains
more
Protein Protein
+1574.3%
Contains
more
Fats Fats
+4726.7%
Contains
more
Carbs Carbs
+1649.8%
Contains
more
Other Other
+1779.7%
Contains
more
Water Water
+1127.1%
Fat Type Comparison
Fat type breakdown side-by-side comparison
2
31%
8%
61%
Saturated fat:
Sat. Fat
1.881 g
Monounsaturated fat:
Mono. Fat
0.474 g
Polyunsaturated fat:
Poly. Fat
3.698 g
1
19%
6%
76%
Saturated fat:
Sat. Fat
0.02 g
Monounsaturated fat:
Mono. Fat
0.006 g
Polyunsaturated fat:
Poly. Fat
0.082 g
Contains
more
Mono. Fat Monounsaturated fat
+7800%
Contains
more
Poly. Fat Polyunsaturated fat
+4409.8%
Contains
less
Sat. Fat Saturated fat
-98.9%