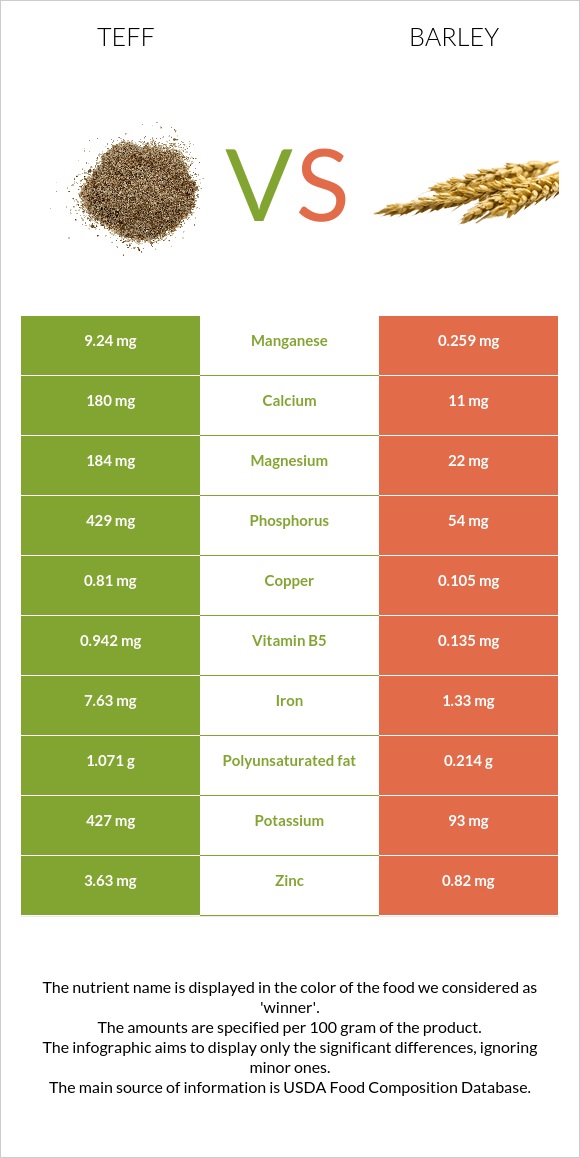
How are teff and barley different? Teff is higher than barley in manganese, iron, copper, phosphorus, magnesium, vitamin B6, vitamin B1, zinc, calcium, and fiber. Teff covers your daily need for manganese, 390% more than barley. Teff contains 16 times more calcium than barley. Teff contains 180mg of calcium, while barley contains 11mg. Teff, uncooked and Barley, pearled, cooked types were used in this article.
Infographic
Mineral Comparison
Mineral comparison score is based on the number of minerals by which one or the other food is richer. The "coverage" charts below show how much of the daily needs can be covered by 300 grams of the food.
8
100 g
300 g
1 cup - 193g
Magnesium
Magnesium
Calcium
Calcium
Potassium
Potassium
Iron
Iron
Copper
Copper
Zinc
Zinc
Phosphorus
Phosphorus
Sodium
Sodium
Manganese
Manganese
Selenium
Selenium
131%
54%
38%
286%
270%
99%
184%
1.6%
1205%
24%
2
100 g
300 g
1 cup - 157g
Magnesium
Magnesium
Calcium
Calcium
Potassium
Potassium
Iron
Iron
Copper
Copper
Zinc
Zinc
Phosphorus
Phosphorus
Sodium
Sodium
Manganese
Manganese
Selenium
Selenium
16%
3.3%
8.2%
50%
35%
22%
23%
0.39%
34%
47%
Vitamin Comparison
Vitamin comparison score is based on the number of vitamins by which one or the other food is richer. The "coverage" charts below show how much of the daily needs can be covered by 300 grams of the food.
7
100 g
300 g
1 cup - 193g
Vitamin C
Vit. C
Vitamin D
Vit. D
Vitamin A
Vit. A
Vitamin E
Vit. E
Vitamin B1
Vit. B1
Vitamin B2
Vit. B2
Vitamin B3
Vit. B3
Vitamin B5
Vit. B5
Vitamin B6
Vit. B6
Vitamin B12
Vit. B12
Vitamin K
Vit. K
Folate
Folate
0%
0%
0%
1.6%
98%
62%
63%
57%
111%
0%
4.8%
0%
1
100 g
300 g
1 cup - 157g
Vitamin C
Vit. C
Vitamin D
Vit. D
Vitamin A
Vit. A
Vitamin E
Vit. E
Vitamin B1
Vit. B1
Vitamin B2
Vit. B2
Vitamin B3
Vit. B3
Vitamin B5
Vit. B5
Vitamin B6
Vit. B6
Vitamin B12
Vit. B12
Vitamin K
Vit. K
Folate
Folate
0%
0%
0%
0.2%
21%
14%
39%
8.1%
27%
0%
2%
12%
All nutrients comparison - raw data values
Nutrient
DV% diff.
Manganese
9.24mg
0.259mg
390%
Iron
7.63mg
1.33mg
79%
Copper
0.81mg
0.105mg
78%
Phosphorus
429mg
54mg
54%
Magnesium
184mg
22mg
39%
Vitamin B6
0.482mg
0.115mg
28%
Zinc
3.63mg
0.82mg
26%
Vitamin B1
0.39mg
0.083mg
26%
Protein
13.3g
2.26g
22%
Calcium
180mg
11mg
17%
Fiber
8g
3.8g
17%
Vitamin B2
0.27mg
0.062mg
16%
Vitamin B5
0.942mg
0.135mg
16%
Carbs
73.13g
28.22g
15%
Starch
36.56g
15%
Calories
367kcal
123kcal
12%
Potassium
427mg
93mg
10%
Selenium
4.4µg
8.6µg
8%
Vitamin B3
3.363mg
2.063mg
8%
Polyunsaturated fat
1.071g
0.214g
6%
Folate
16µg
4%
Fats
2.38g
0.44g
3%
Saturated fat
0.449g
0.093g
2%
Vitamin K
1.9µg
0.8µg
1%
Monounsaturated fat
0.589g
0.057g
1%
Fructose
0.47g
1%
Protein per 100 calories
3.6g
1.8g
N/A
Calories per 10 g protein
276kcal
544kcal
N/A
Weight per 100 calories
27g
81g
N/A
Unsaturated / Saturated Fat ratio
3.7
2.9
N/A
Net carbs
65.13g
24.42g
N/A
Sugar
1.84g
0.28g
N/A
Sodium
12mg
3mg
0%
Vitamin E
0.08mg
0.01mg
0%
Choline
13.1mg
13.4mg
0%
Tryptophan
0.139mg
0.038mg
0%
Threonine
0.51mg
0.077mg
0%
Isoleucine
0.501mg
0.083mg
0%
Leucine
1.068mg
0.154mg
0%
Lysine
0.376mg
0.084mg
0%
Methionine
0.428mg
0.043mg
0%
Phenylalanine
0.698mg
0.127mg
0%
Valine
0.686mg
0.111mg
0%
Histidine
0.301mg
0.051mg
0%
Omega-3 - ALA
0.135g
N/A
Macronutrient Comparison
Macronutrient breakdown side-by-side comparison
4
13%
2%
73%
9%
2%
Protein:
13.3 g
Fats:
2.38 g
Carbs:
73.13 g
Water:
8.82 g
Other:
2.37 g
1
2%
28%
69%
Protein:
2.26 g
Fats:
0.44 g
Carbs:
28.22 g
Water:
68.8 g
Other:
0.28 g
Contains
more
Protein Protein
+488.5%
Contains
more
Fats Fats
+440.9%
Contains
more
Carbs Carbs
+159.1%
Contains
more
Other Other
+746.4%
Contains
more
Water Water
+680%
Fat Type Comparison
Fat type breakdown side-by-side comparison
2
21%
28%
51%
Saturated fat:
Sat. Fat
0.449 g
Monounsaturated fat:
Mono. Fat
0.589 g
Polyunsaturated fat:
Poly. Fat
1.071 g
1
26%
16%
59%
Saturated fat:
Sat. Fat
0.093 g
Monounsaturated fat:
Mono. Fat
0.057 g
Polyunsaturated fat:
Poly. Fat
0.214 g
Contains
more
Mono. Fat Monounsaturated fat
+933.3%
Contains
more
Poly. Fat Polyunsaturated fat
+400.5%
Contains
less
Sat. Fat Saturated fat
-79.3%