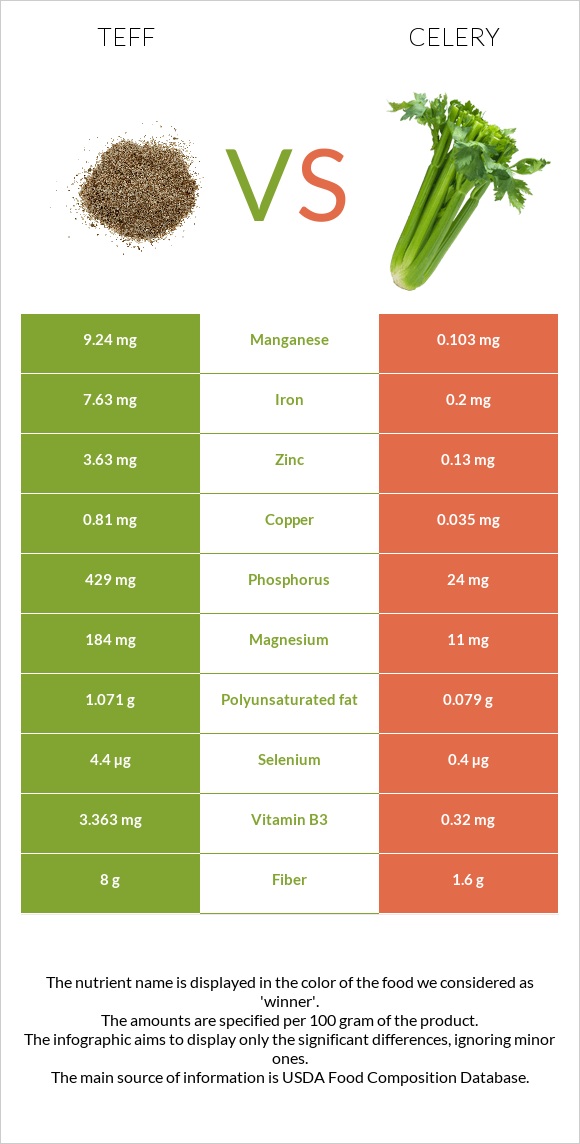
A recap on the differences between teff and celery Teff has more manganese, iron, copper, phosphorus, magnesium, zinc, vitamin B6, vitamin B1, and fiber; however, celery is higher in vitamin K. Teff covers your daily manganese needs 397% more than celery. Celery contains 38 times less iron than teff. Teff contains 7.63mg of iron, while celery contains 0.2mg. Food varieties used in this article are Teff, uncooked and Celery, raw .
Infographic
Mineral Comparison
Mineral comparison score is based on the number of minerals by which one or the other food is richer. The "coverage" charts below show how much of the daily needs can be covered by 300 grams of the food.
10
100 g
300 g
1 cup - 193g
Magnesium
Magnesium
Calcium
Calcium
Potassium
Potassium
Iron
Iron
Copper
Copper
Zinc
Zinc
Phosphorus
Phosphorus
Sodium
Sodium
Manganese
Manganese
Selenium
Selenium
131%
54%
38%
286%
270%
99%
184%
1.6%
1205%
24%
0
100 g
300 g
1 strip (4" long) - 4g 1 tbsp - 7.5g 1 stalk, small (5" long) - 17g 1 stalk, medium (7-1/2" - 8" long) - 40g 1 stalk, large (11"-12" long) - 64g 1 cup chopped - 101g 1 NLEA serving - 110g
Magnesium
Magnesium
Calcium
Calcium
Potassium
Potassium
Iron
Iron
Copper
Copper
Zinc
Zinc
Phosphorus
Phosphorus
Sodium
Sodium
Manganese
Manganese
Selenium
Selenium
7.9%
12%
23%
7.5%
12%
3.5%
10%
10%
13%
2.2%
Vitamin Comparison
Vitamin comparison score is based on the number of vitamins by which one or the other food is richer. The "coverage" charts below show how much of the daily needs can be covered by 300 grams of the food.
5
100 g
300 g
1 cup - 193g
Vitamin C
Vit. C
Vitamin D
Vit. D
Vitamin A
Vit. A
Vitamin E
Vit. E
Vitamin B1
Vit. B1
Vitamin B2
Vit. B2
Vitamin B3
Vit. B3
Vitamin B5
Vit. B5
Vitamin B6
Vit. B6
Vitamin B12
Vit. B12
Vitamin K
Vit. K
Folate
Folate
0%
0%
0%
1.6%
98%
62%
63%
57%
111%
0%
4.8%
0%
5
100 g
300 g
1 strip (4" long) - 4g 1 tbsp - 7.5g 1 stalk, small (5" long) - 17g 1 stalk, medium (7-1/2" - 8" long) - 40g 1 stalk, large (11"-12" long) - 64g 1 cup chopped - 101g 1 NLEA serving - 110g
Vitamin C
Vit. C
Vitamin D
Vit. D
Vitamin A
Vit. A
Vitamin E
Vit. E
Vitamin B1
Vit. B1
Vitamin B2
Vit. B2
Vitamin B3
Vit. B3
Vitamin B5
Vit. B5
Vitamin B6
Vit. B6
Vitamin B12
Vit. B12
Vitamin K
Vit. K
Folate
Folate
10%
0%
7.3%
5.4%
5.3%
13%
6%
15%
17%
0%
73%
27%
All nutrients comparison - raw data values
Nutrient
DV% diff.
Manganese
9.24mg
0.103mg
397%
Iron
7.63mg
0.2mg
93%
Copper
0.81mg
0.035mg
86%
Phosphorus
429mg
24mg
58%
Magnesium
184mg
11mg
41%
Zinc
3.63mg
0.13mg
32%
Vitamin B1
0.39mg
0.021mg
31%
Vitamin B6
0.482mg
0.074mg
31%
Fiber
8g
1.6g
26%
Protein
13.3g
0.69g
25%
Carbs
73.13g
2.97g
23%
Vitamin K
1.9µg
29.3µg
23%
Vitamin B3
3.363mg
0.32mg
19%
Calories
367kcal
16kcal
18%
Vitamin B2
0.27mg
0.057mg
16%
Starch
36.56g
0g
15%
Calcium
180mg
40mg
14%
Vitamin B5
0.942mg
0.246mg
14%
Folate
36µg
9%
Selenium
4.4µg
0.4µg
7%
Polyunsaturated fat
1.071g
0.079g
7%
Potassium
427mg
260mg
5%
Fats
2.38g
0.17g
3%
Vitamin C
3.1mg
3%
Sodium
12mg
80mg
3%
Vitamin A
0µg
22µg
2%
Saturated fat
0.449g
0.042g
2%
Vitamin E
0.08mg
0.27mg
1%
Choline
13.1mg
6.1mg
1%
Monounsaturated fat
0.589g
0.032g
1%
Protein per 100 calories
3.6g
4.3g
N/A
Calories per 10 g protein
276kcal
232kcal
N/A
Weight per 100 calories
27g
625g
N/A
Unsaturated / Saturated Fat ratio
3.7
2.6
N/A
Net carbs
65.13g
1.37g
N/A
Sugar
1.84g
1.34g
N/A
Tryptophan
0.139mg
0.009mg
0%
Threonine
0.51mg
0.02mg
0%
Isoleucine
0.501mg
0.021mg
0%
Leucine
1.068mg
0.032mg
0%
Lysine
0.376mg
0.027mg
0%
Methionine
0.428mg
0.005mg
0%
Phenylalanine
0.698mg
0.02mg
0%
Valine
0.686mg
0.027mg
0%
Histidine
0.301mg
0.012mg
0%
Fructose
0.47g
0.37g
0%
Omega-3 - ALA
0.135g
N/A
Macronutrient Comparison
Macronutrient breakdown side-by-side comparison
4
13%
2%
73%
9%
2%
Protein:
13.3 g
Fats:
2.38 g
Carbs:
73.13 g
Water:
8.82 g
Other:
2.37 g
1
3%
95%
Protein:
0.69 g
Fats:
0.17 g
Carbs:
2.97 g
Water:
95.43 g
Other:
0.74 g
Contains
more
Protein Protein
+1827.5%
Contains
more
Fats Fats
+1300%
Contains
more
Carbs Carbs
+2362.3%
Contains
more
Other Other
+220.3%
Contains
more
Water Water
+982%
Fat Type Comparison
Fat type breakdown side-by-side comparison
2
21%
28%
51%
Saturated fat:
Sat. Fat
0.449 g
Monounsaturated fat:
Mono. Fat
0.589 g
Polyunsaturated fat:
Poly. Fat
1.071 g
1
27%
21%
52%
Saturated fat:
Sat. Fat
0.042 g
Monounsaturated fat:
Mono. Fat
0.032 g
Polyunsaturated fat:
Poly. Fat
0.079 g
Contains
more
Mono. Fat Monounsaturated fat
+1740.6%
Contains
more
Poly. Fat Polyunsaturated fat
+1255.7%
Contains
less
Sat. Fat Saturated fat
-90.6%
Carbohydrate type comparison
Carbohydrate type breakdown side-by-side comparison
5
95%
2%
Starch:
36.56 g
Sucrose:
0.62 g
Glucose:
0.73 g
Fructose:
0.47 g
Lactose:
0 g
Maltose:
0.01 g
Galactose:
0 g
1
6%
30%
28%
36%
Starch:
0 g
Sucrose:
0.08 g
Glucose:
0.4 g
Fructose:
0.37 g
Lactose:
0 g
Maltose:
0 g
Galactose:
0.48 g
Contains
more
Starch Starch
+∞%
Contains
more
Sucrose Sucrose
+675%
Contains
more
Glucose Glucose
+82.5%
Contains
more
Fructose Fructose
+27%
Contains
more
Maltose Maltose
+∞%
Contains
more
Galactose Galactose
+∞%