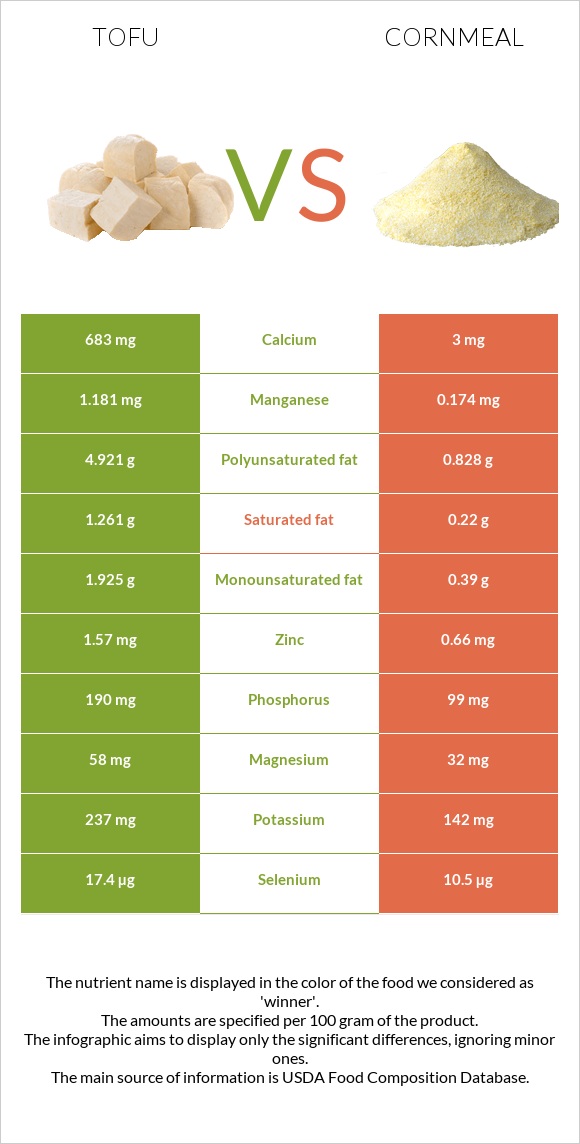
How are tofu and cornmeal different? Tofu is richer in calcium, manganese, copper, phosphorus, and selenium, while cornmeal is higher in folate, vitamin B1, vitamin B3, vitamin B2, and iron. Tofu covers your daily need for calcium, 68% more than cornmeal. Tofu contains 7 times more manganese than cornmeal. Tofu contains 1.181mg of manganese, while cornmeal contains 0.174mg. Cornmeal has a higher glycemic index (68) than tofu (15). Tofu, raw, firm, prepared with calcium sulfate and Cornmeal, degermed, enriched, yellow types were used in this article.
Infographic
Mineral Comparison
Mineral comparison score is based on the number of minerals by which one or the other food is richer. The "coverage" charts below show how much of the daily needs can be covered by 300 grams of the food.
8
100 g
300 g
0.25 block - 81g 0.5 cup - 126g
Magnesium
Magnesium
Calcium
Calcium
Potassium
Potassium
Iron
Iron
Copper
Copper
Zinc
Zinc
Phosphorus
Phosphorus
Sodium
Sodium
Manganese
Manganese
Selenium
Selenium
41%
205%
21%
100%
126%
43%
81%
1.8%
154%
95%
2
100 g
300 g
1 cup - 157g
Magnesium
Magnesium
Calcium
Calcium
Potassium
Potassium
Iron
Iron
Copper
Copper
Zinc
Zinc
Phosphorus
Phosphorus
Sodium
Sodium
Manganese
Manganese
Selenium
Selenium
23%
0.9%
13%
164%
25%
18%
42%
0.91%
23%
57%
Vitamin Comparison
Vitamin comparison score is based on the number of vitamins by which one or the other food is richer. The "coverage" charts below show how much of the daily needs can be covered by 300 grams of the food.
1
100 g
300 g
0.25 block - 81g 0.5 cup - 126g
Vitamin C
Vit. C
Vitamin D
Vit. D
Vitamin A
Vit. A
Vitamin E
Vit. E
Vitamin B1
Vit. B1
Vitamin B2
Vit. B2
Vitamin B3
Vit. B3
Vitamin B5
Vit. B5
Vitamin B6
Vit. B6
Vitamin B12
Vit. B12
Vitamin K
Vit. K
Folate
Folate
0.67%
0%
0%
0%
40%
24%
7.1%
8%
21%
0%
0%
22%
8
100 g
300 g
1 cup - 157g
Vitamin C
Vit. C
Vitamin D
Vit. D
Vitamin A
Vit. A
Vitamin E
Vit. E
Vitamin B1
Vit. B1
Vitamin B2
Vit. B2
Vitamin B3
Vit. B3
Vitamin B5
Vit. B5
Vitamin B6
Vit. B6
Vitamin B12
Vit. B12
Vitamin K
Vit. K
Folate
Folate
0%
0%
3.7%
2.4%
138%
88%
93%
14%
42%
0%
0%
157%
All nutrients comparison - raw data values
Nutrient
DV% diff.
Calcium
683mg
3mg
68%
Folate
29µg
209µg
45%
Manganese
1.181mg
0.174mg
44%
Copper
0.378mg
0.076mg
34%
Vitamin B1
0.158mg
0.551mg
33%
Starch
73.3g
30%
Vitamin B3
0.381mg
4.968mg
29%
Polyunsaturated fat
4.921g
0.828g
27%
Carbs
2.78g
79.45g
26%
Vitamin B2
0.102mg
0.382mg
22%
Iron
2.66mg
4.36mg
21%
Protein
17.27g
7.11g
20%
Phosphorus
190mg
99mg
13%
Selenium
17.4µg
10.5µg
13%
Calories
144kcal
370kcal
11%
Fats
8.72g
1.75g
11%
Zinc
1.57mg
0.66mg
8%
Vitamin B6
0.092mg
0.182mg
7%
Magnesium
58mg
32mg
6%
Fiber
2.3g
3.9g
6%
Saturated fat
1.261g
0.22g
5%
Monounsaturated fat
1.925g
0.39g
4%
Potassium
237mg
142mg
3%
Vitamin B5
0.133mg
0.24mg
2%
Choline
8.6mg
2%
Vitamin A
11µg
1%
Vitamin E
0.12mg
1%
Protein per 100 calories
12g
1.9g
N/A
Calories per 10 g protein
83kcal
520kcal
N/A
Weight per 100 calories
69g
27g
N/A
Unsaturated / Saturated Fat ratio
5.4
5.5
N/A
Vitamin C
0.2mg
0mg
0%
Net carbs
0.48g
75.55g
N/A
Sugar
1.61g
N/A
Sodium
14mg
7mg
0%
Tryptophan
0.235mg
0.038mg
0%
Threonine
0.785mg
0.172mg
0%
Isoleucine
0.849mg
0.242mg
0%
Leucine
1.392mg
1.006mg
0%
Lysine
0.883mg
0.105mg
0%
Methionine
0.211mg
0.162mg
0%
Phenylalanine
0.835mg
0.366mg
0%
Valine
0.87mg
0.337mg
0%
Histidine
0.431mg
0.172mg
0%
Fructose
0.17g
0%
Macronutrient Comparison
Macronutrient breakdown side-by-side comparison
4
17%
9%
3%
70%
Protein:
17.27 g
Fats:
8.72 g
Carbs:
2.78 g
Water:
69.83 g
Other:
1.4 g
1
7%
2%
79%
11%
Protein:
7.11 g
Fats:
1.75 g
Carbs:
79.45 g
Water:
11.18 g
Other:
0.51 g
Contains
more
Protein Protein
+142.9%
Contains
more
Fats Fats
+398.3%
Contains
more
Water Water
+524.6%
Contains
more
Other Other
+174.5%
Contains
more
Carbs Carbs
+2757.9%
Fat Type Comparison
Fat type breakdown side-by-side comparison
2
16%
24%
61%
Saturated fat:
Sat. Fat
1.261 g
Monounsaturated fat:
Mono. Fat
1.925 g
Polyunsaturated fat:
Poly. Fat
4.921 g
1
15%
27%
58%
Saturated fat:
Sat. Fat
0.22 g
Monounsaturated fat:
Mono. Fat
0.39 g
Polyunsaturated fat:
Poly. Fat
0.828 g
Contains
more
Mono. Fat Monounsaturated fat
+393.6%
Contains
more
Poly. Fat Polyunsaturated fat
+494.3%
Contains
less
Sat. Fat Saturated fat
-82.6%