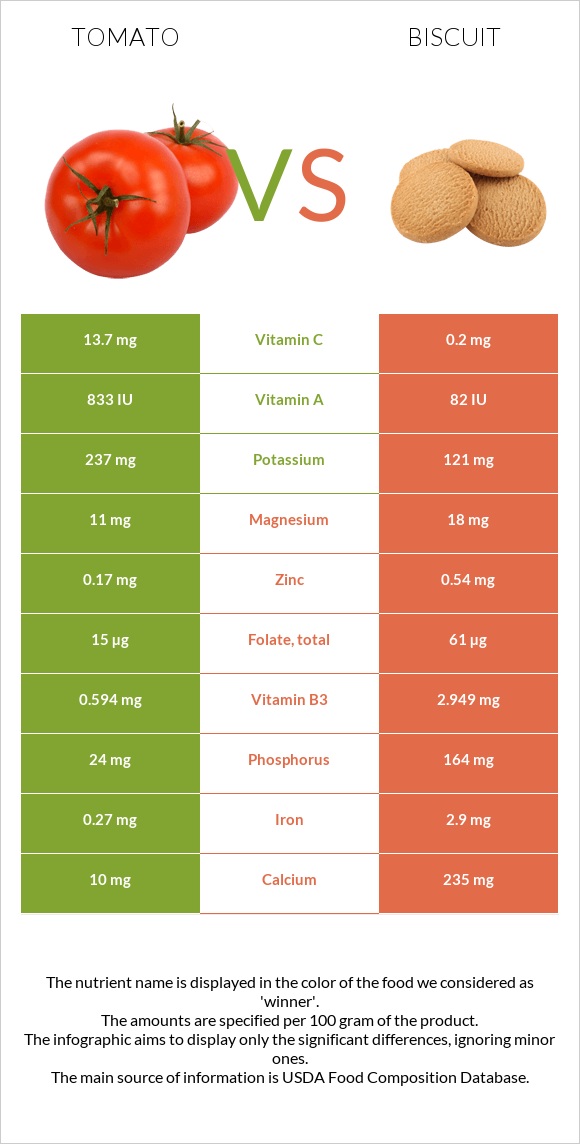
A recap on the differences between tomatoes and biscuits Tomatoes are higher in vitamin A and vitamin C, yet biscuits are higher in selenium, iron, vitamin B1, calcium, vitamin B2, and phosphorus. Biscuits cover your daily selenium needs 35% more than tomatoes. Tomatoes contain 69 times more vitamin C than biscuits. While tomatoes contain 13.7mg of vitamin C, biscuits contain only 0.2mg. The amount of sodium in tomatoes is lower. The glycemic index of tomatoes is lower. Food varieties used in this article are Tomatoes, red, ripe, raw, year round average and Biscuits, plain or buttermilk, prepared from recipe .
Infographic
Mineral Comparison
Mineral comparison score is based on the number of minerals by which one or the other food is richer. The "coverage" charts below show how much of the daily needs can be covered by 300 grams of the food.
2
100 g
300 g
1 slice, thin/small - 15g 1 cherry - 17g 1 slice, medium (1/4" thick) - 20g 1 slice, thick/large (1/2" thick) - 27g 1 wedge (1/4 of medium tomato) - 31g 1 Italian tomato - 62g 1 plum tomato - 62g 1 small whole (2-2/5" dia) - 91g 1 medium whole (2-3/5" dia) - 123g 1 NLEA serving - 148g 1 cup cherry tomatoes - 149g 1 cup, chopped or sliced - 180g 1 large whole (3" dia) - 182g
Magnesium
Magnesium
Calcium
Calcium
Potassium
Potassium
Iron
Iron
Copper
Copper
Zinc
Zinc
Phosphorus
Phosphorus
Sodium
Sodium
Manganese
Manganese
Selenium
Selenium
7.9%
3%
21%
10%
20%
4.6%
10%
0.65%
15%
0%
8
100 g
300 g
1 small (1-1/2" dia) - 14g 1 oz - 28.35g 1 biscuit (2-1/2" dia) - 60g 1 biscuit (4" dia) - 101g
Magnesium
Magnesium
Calcium
Calcium
Potassium
Potassium
Iron
Iron
Copper
Copper
Zinc
Zinc
Phosphorus
Phosphorus
Sodium
Sodium
Manganese
Manganese
Selenium
Selenium
13%
71%
11%
109%
27%
15%
70%
76%
49%
106%
Vitamin Comparison
Vitamin comparison score is based on the number of vitamins by which one or the other food is richer. The "coverage" charts below show how much of the daily needs can be covered by 300 grams of the food.
5
100 g
300 g
1 slice, thin/small - 15g 1 cherry - 17g 1 slice, medium (1/4" thick) - 20g 1 slice, thick/large (1/2" thick) - 27g 1 wedge (1/4 of medium tomato) - 31g 1 Italian tomato - 62g 1 plum tomato - 62g 1 small whole (2-2/5" dia) - 91g 1 medium whole (2-3/5" dia) - 123g 1 NLEA serving - 148g 1 cup cherry tomatoes - 149g 1 cup, chopped or sliced - 180g 1 large whole (3" dia) - 182g
Vitamin C
Vit. C
Vitamin D
Vit. D
Vitamin A
Vit. A
Vitamin E
Vit. E
Vitamin B1
Vit. B1
Vitamin B2
Vit. B2
Vitamin B3
Vit. B3
Vitamin B5
Vit. B5
Vitamin B6
Vit. B6
Vitamin B12
Vit. B12
Vitamin K
Vit. K
Folate
Folate
46%
0%
14%
11%
9.3%
4.4%
11%
5.3%
18%
0%
20%
11%
6
100 g
300 g
1 small (1-1/2" dia) - 14g 1 oz - 28.35g 1 biscuit (2-1/2" dia) - 60g 1 biscuit (4" dia) - 101g
Vitamin C
Vit. C
Vitamin D
Vit. D
Vitamin A
Vit. A
Vitamin E
Vit. E
Vitamin B1
Vit. B1
Vitamin B2
Vit. B2
Vitamin B3
Vit. B3
Vitamin B5
Vit. B5
Vitamin B6
Vit. B6
Vitamin B12
Vit. B12
Vitamin K
Vit. K
Folate
Folate
0.67%
0%
0%
0%
89%
72%
55%
17%
8.1%
10%
0%
46%
All nutrients comparison - raw data values
Nutrient
DV% diff.
Selenium
0µg
19.5µg
35%
Iron
0.27mg
2.9mg
33%
Vitamin B1
0.037mg
0.356mg
27%
Polyunsaturated fat
0.083g
4.163g
27%
Fats
0.2g
16.3g
25%
Sodium
5mg
580mg
25%
Calcium
10mg
235mg
23%
Vitamin B2
0.019mg
0.31mg
22%
Phosphorus
24mg
164mg
20%
Saturated fat
0.028g
4.324g
20%
Calories
18kcal
353kcal
17%
Monounsaturated fat
0.031g
6.93g
17%
Vitamin C
13.7mg
0.2mg
15%
Vitamin B3
0.594mg
2.949mg
15%
Carbs
3.89g
44.6g
14%
Protein
0.88g
7g
12%
Folate
15µg
61µg
12%
Manganese
0.114mg
0.378mg
11%
Vitamin K
7.9µg
7%
Vitamin A
42µg
5%
Vitamin E
0.54mg
4%
Vitamin B5
0.089mg
0.285mg
4%
Potassium
237mg
121mg
3%
Copper
0.059mg
0.082mg
3%
Zinc
0.17mg
0.54mg
3%
Vitamin B6
0.08mg
0.035mg
3%
Vitamin B12
0µg
0.08µg
3%
Magnesium
11mg
18mg
2%
Fructose
1.37g
2%
Cholesterol
0mg
3mg
1%
Fiber
1.2g
1.5g
1%
Choline
6.7mg
1%
Protein per 100 calories
4.9g
2g
N/A
Calories per 10 g protein
205kcal
504kcal
N/A
Weight per 100 calories
556g
28g
N/A
Unsaturated / Saturated Fat ratio
4.1
2.6
N/A
Net carbs
2.69g
43.1g
N/A
Sugar
2.63g
2.18g
N/A
Tryptophan
0.006mg
0.087mg
0%
Threonine
0.027mg
0.211mg
0%
Isoleucine
0.018mg
0.273mg
0%
Leucine
0.025mg
0.514mg
0%
Lysine
0.027mg
0.226mg
0%
Methionine
0.006mg
0.132mg
0%
Phenylalanine
0.027mg
0.347mg
0%
Valine
0.018mg
0.313mg
0%
Histidine
0.014mg
0.161mg
0%
Macronutrient Comparison
Macronutrient breakdown side-by-side comparison
1
4%
95%
Protein:
0.88 g
Fats:
0.2 g
Carbs:
3.89 g
Water:
94.52 g
Other:
0.51 g
4
7%
16%
45%
29%
3%
Protein:
7 g
Fats:
16.3 g
Carbs:
44.6 g
Water:
28.9 g
Other:
3.2 g
Contains
more
Water Water
+227.1%
Contains
more
Protein Protein
+695.5%
Contains
more
Fats Fats
+8050%
Contains
more
Carbs Carbs
+1046.5%
Contains
more
Other Other
+527.5%
Fat Type Comparison
Fat type breakdown side-by-side comparison
1
20%
22%
58%
Saturated fat:
Sat. Fat
0.028 g
Monounsaturated fat:
Mono. Fat
0.031 g
Polyunsaturated fat:
Poly. Fat
0.083 g
2
28%
45%
27%
Saturated fat:
Sat. Fat
4.324 g
Monounsaturated fat:
Mono. Fat
6.93 g
Polyunsaturated fat:
Poly. Fat
4.163 g
Contains
less
Sat. Fat Saturated fat
-99.4%
Contains
more
Mono. Fat Monounsaturated fat
+22254.8%
Contains
more
Poly. Fat Polyunsaturated fat
+4915.7%