Significant differences between tomatoes and flour Tomatoes have more vitamin A and vitamin C; however, flour is richer in vitamin B1, selenium, iron, folate, vitamin B2, vitamin B3, manganese, and phosphorus. Flour covers your daily vitamin B1 needs 62% more than tomatoes. Flour has a higher glycemic index. The glycemic index of flour is 72, while the glycemic index of tomatoes is 23. Specific food types used in this comparison are Tomatoes, red, ripe, raw, year round average and Wheat flour, white, all-purpose, enriched, bleached .
Infographic
Mineral Comparison
Mineral comparison score is based on the number of minerals by which one or the other food is richer. The "coverage" charts below show how much of the daily needs can be covered by 300 grams of the food.
1
100 g
300 g
1 slice, thin/small - 15g 1 cherry - 17g 1 slice, medium (1/4" thick) - 20g 1 slice, thick/large (1/2" thick) - 27g 1 wedge (1/4 of medium tomato) - 31g 1 Italian tomato - 62g 1 plum tomato - 62g 1 small whole (2-2/5" dia) - 91g 1 medium whole (2-3/5" dia) - 123g 1 NLEA serving - 148g 1 cup cherry tomatoes - 149g 1 cup, chopped or sliced - 180g 1 large whole (3" dia) - 182g
Magnesium
Magnesium
Calcium
Calcium
Potassium
Potassium
Iron
Iron
Copper
Copper
Zinc
Zinc
Phosphorus
Phosphorus
Sodium
Sodium
Manganese
Manganese
Selenium
Selenium
7.9%
3%
21%
10%
20%
4.6%
10%
0.65%
15%
0%
9
100 g
300 g
1 cup - 125g
Magnesium
Magnesium
Calcium
Calcium
Potassium
Potassium
Iron
Iron
Copper
Copper
Zinc
Zinc
Phosphorus
Phosphorus
Sodium
Sodium
Manganese
Manganese
Selenium
Selenium
16%
4.5%
9.4%
174%
48%
19%
46%
0.26%
89%
185%
Vitamin Comparison
Vitamin comparison score is based on the number of vitamins by which one or the other food is richer. The "coverage" charts below show how much of the daily needs can be covered by 300 grams of the food.
5
100 g
300 g
1 slice, thin/small - 15g 1 cherry - 17g 1 slice, medium (1/4" thick) - 20g 1 slice, thick/large (1/2" thick) - 27g 1 wedge (1/4 of medium tomato) - 31g 1 Italian tomato - 62g 1 plum tomato - 62g 1 small whole (2-2/5" dia) - 91g 1 medium whole (2-3/5" dia) - 123g 1 NLEA serving - 148g 1 cup cherry tomatoes - 149g 1 cup, chopped or sliced - 180g 1 large whole (3" dia) - 182g
Vitamin C
Vit. C
Vitamin D
Vit. D
Vitamin A
Vit. A
Vitamin E
Vit. E
Vitamin B1
Vit. B1
Vitamin B2
Vit. B2
Vitamin B3
Vit. B3
Vitamin B5
Vit. B5
Vitamin B6
Vit. B6
Vitamin B12
Vit. B12
Vitamin K
Vit. K
Folate
Folate
46%
0%
14%
11%
9.3%
4.4%
11%
5.3%
18%
0%
20%
11%
5
100 g
300 g
1 cup - 125g
Vitamin C
Vit. C
Vitamin D
Vit. D
Vitamin A
Vit. A
Vitamin E
Vit. E
Vitamin B1
Vit. B1
Vitamin B2
Vit. B2
Vitamin B3
Vit. B3
Vitamin B5
Vit. B5
Vitamin B6
Vit. B6
Vitamin B12
Vit. B12
Vitamin K
Vit. K
Folate
Folate
0%
0%
0%
1.2%
196%
114%
111%
26%
10%
0%
0.75%
137%
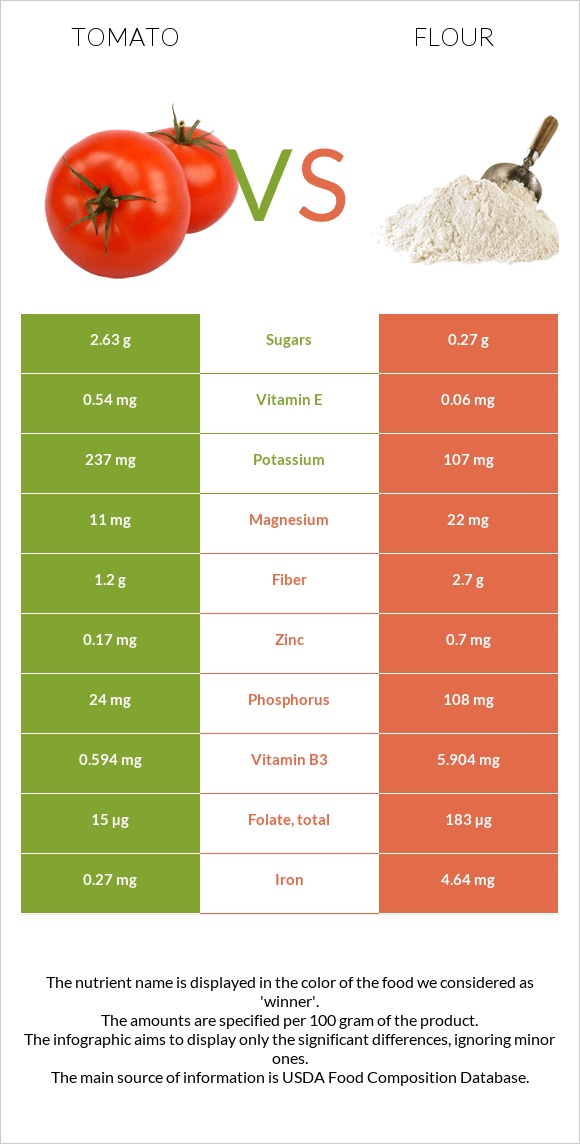
All nutrients comparison - raw data values
Nutrient
DV% diff.
Selenium
0µg
33.9µg
62%
Vitamin B1
0.037mg
0.785mg
62%
Iron
0.27mg
4.64mg
55%
Folate
15µg
183µg
42%
Vitamin B2
0.019mg
0.494mg
37%
Vitamin B3
0.594mg
5.904mg
33%
Manganese
0.114mg
0.682mg
25%
Carbs
3.89g
76.31g
24%
Protein
0.88g
10.33g
19%
Calories
18kcal
364kcal
17%
Vitamin C
13.7mg
0mg
15%
Phosphorus
24mg
108mg
12%
Copper
0.059mg
0.144mg
9%
Vitamin B5
0.089mg
0.438mg
7%
Fiber
1.2g
2.7g
6%
Vitamin K
7.9µg
0.3µg
6%
Zinc
0.17mg
0.7mg
5%
Vitamin A
42µg
0µg
5%
Potassium
237mg
107mg
4%
Magnesium
11mg
22mg
3%
Vitamin E
0.54mg
0.06mg
3%
Vitamin B6
0.08mg
0.044mg
3%
Polyunsaturated fat
0.083g
0.413g
2%
Fructose
1.37g
2%
Fats
0.2g
0.98g
1%
Calcium
10mg
15mg
1%
Choline
6.7mg
10.4mg
1%
Saturated fat
0.028g
0.155g
1%
Protein per 100 calories
4.9g
2.8g
N/A
Calories per 10 g protein
205kcal
352kcal
N/A
Weight per 100 calories
556g
27g
N/A
Net carbs
2.69g
73.61g
N/A
Sugar
2.63g
0.27g
N/A
Sodium
5mg
2mg
0%
Monounsaturated fat
0.031g
0.087g
0%
Tryptophan
0.006mg
0.127mg
0%
Threonine
0.027mg
0.281mg
0%
Isoleucine
0.018mg
0.357mg
0%
Leucine
0.025mg
0.71mg
0%
Lysine
0.027mg
0.228mg
0%
Methionine
0.006mg
0.183mg
0%
Phenylalanine
0.027mg
0.52mg
0%
Valine
0.018mg
0.415mg
0%
Histidine
0.014mg
0.23mg
0%
Macronutrient Comparison
Macronutrient breakdown side-by-side comparison
2
4%
95%
Protein:
0.88 g
Fats:
0.2 g
Carbs:
3.89 g
Water:
94.52 g
Other:
0.51 g
3
10%
76%
12%
Protein:
10.33 g
Fats:
0.98 g
Carbs:
76.31 g
Water:
11.92 g
Other:
0.46 g
Contains
more
Water Water
+693%
Contains
more
Protein Protein
+1073.9%
Contains
more
Fats Fats
+390%
Contains
more
Carbs Carbs
+1861.7%
Fat Type Comparison
Fat type breakdown side-by-side comparison
1
20%
22%
58%
Saturated fat:
Sat. Fat
0.028 g
Monounsaturated fat:
Mono. Fat
0.031 g
Polyunsaturated fat:
Poly. Fat
0.083 g
2
24%
13%
63%
Saturated fat:
Sat. Fat
0.155 g
Monounsaturated fat:
Mono. Fat
0.087 g
Polyunsaturated fat:
Poly. Fat
0.413 g
Contains
less
Sat. Fat Saturated fat
-81.9%
Contains
more
Mono. Fat Monounsaturated fat
+180.6%
Contains
more
Poly. Fat Polyunsaturated fat
+397.6%