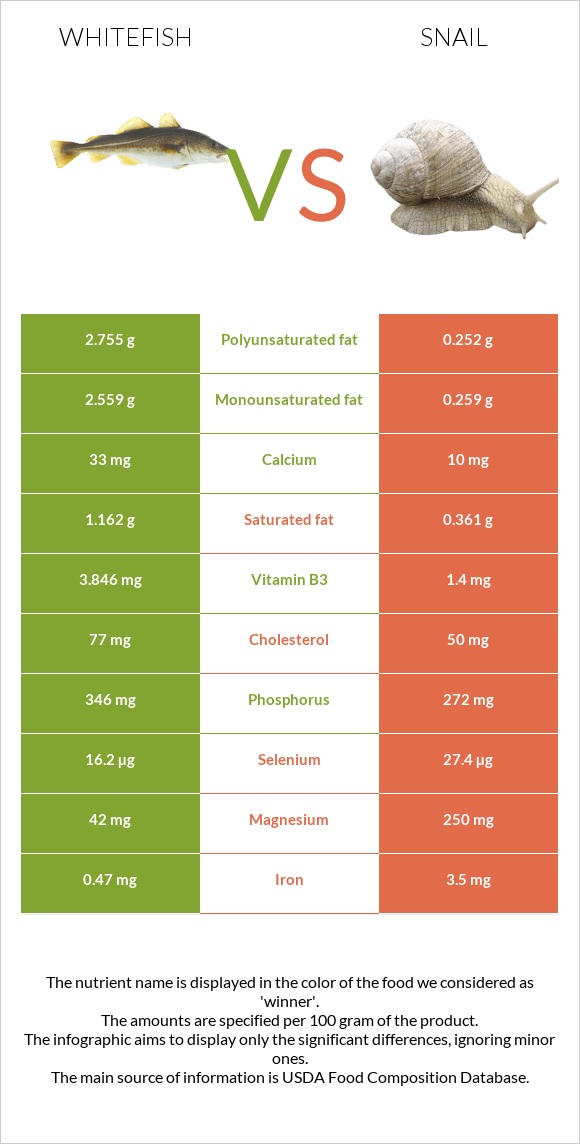
Summary of differences between whitefish and snail Whitefish has more vitamin B12, vitamin B6, vitamin B3, vitamin B1, and phosphorus, while snail has more magnesium, iron, copper, and selenium. Snail covers your daily need for magnesium, 50% more than whitefish. Whitefish contains 17 times more vitamin B1 than snail. While whitefish contains 0.171mg of vitamin B1, snail contains only 0.01mg. The amount of cholesterol in snail is lower. These are the specific foods used in this comparison Fish, whitefish, mixed species, cooked, dry heat and Mollusks, snail, raw .
Infographic
Mineral Comparison
Mineral comparison score is based on the number of minerals by which one or the other food is richer. The "coverage" charts below show how much of the daily needs can be covered by 300 grams of the food.
4
100 g
300 g
3 oz - 85g 1 fillet - 154g
Magnesium
Magnesium
Calcium
Calcium
Potassium
Potassium
Iron
Iron
Copper
Copper
Zinc
Zinc
Phosphorus
Phosphorus
Sodium
Sodium
Manganese
Manganese
Selenium
Selenium
30%
9.9%
36%
18%
31%
35%
148%
8.5%
11%
88%
4
100 g
300 g
3 oz - 85g
Magnesium
Magnesium
Calcium
Calcium
Potassium
Potassium
Iron
Iron
Copper
Copper
Zinc
Zinc
Phosphorus
Phosphorus
Sodium
Sodium
Manganese
Manganese
Selenium
Selenium
179%
3%
34%
131%
133%
27%
117%
9.1%
0%
149%
Vitamin Comparison
Vitamin comparison score is based on the number of vitamins by which one or the other food is richer. The "coverage" charts below show how much of the daily needs can be covered by 300 grams of the food.
8
100 g
300 g
3 oz - 85g 1 fillet - 154g
Vitamin C
Vit. C
Vitamin D
Vit. D
Vitamin A
Vit. A
Vitamin E
Vit. E
Vitamin B1
Vit. B1
Vitamin B2
Vit. B2
Vitamin B3
Vit. B3
Vitamin B5
Vit. B5
Vitamin B6
Vit. B6
Vitamin B12
Vit. B12
Vitamin K
Vit. K
Folate
Folate
0%
0%
13%
0%
43%
36%
72%
52%
80%
120%
0%
13%
2
100 g
300 g
3 oz - 85g
Vitamin C
Vit. C
Vitamin D
Vit. D
Vitamin A
Vit. A
Vitamin E
Vit. E
Vitamin B1
Vit. B1
Vitamin B2
Vit. B2
Vitamin B3
Vit. B3
Vitamin B5
Vit. B5
Vitamin B6
Vit. B6
Vitamin B12
Vit. B12
Vitamin K
Vit. K
Folate
Folate
0%
0%
10%
100%
2.5%
28%
26%
0%
30%
63%
0.25%
4.5%
All nutrients comparison - raw data values
Nutrient
DV% diff.
Magnesium
42mg
250mg
50%
Iron
0.47mg
3.5mg
38%
Copper
0.092mg
0.4mg
34%
Vitamin E
5mg
33%
Selenium
16.2µg
27.4µg
20%
Vitamin B12
0.96µg
0.5µg
19%
Protein
24.47g
16.1g
17%
Vitamin B5
0.865mg
17%
Vitamin B6
0.346mg
0.13mg
17%
Polyunsaturated fat
2.755g
0.252g
17%
Vitamin B3
3.846mg
1.4mg
15%
Vitamin B1
0.171mg
0.01mg
13%
Choline
65mg
12%
Phosphorus
346mg
272mg
11%
Fats
7.51g
1.4g
9%
Cholesterol
77mg
50mg
9%
Monounsaturated fat
2.559g
0.259g
6%
Calories
172kcal
90kcal
4%
Manganese
0.086mg
4%
Saturated fat
1.162g
0.361g
4%
Vitamin B2
0.154mg
0.12mg
3%
Folate
17µg
6µg
3%
Calcium
33mg
10mg
2%
Zinc
1.27mg
1mg
2%
Carbs
0g
2g
1%
Potassium
406mg
382mg
1%
Vitamin A
39µg
30µg
1%
Protein per 100 calories
14g
18g
N/A
Calories per 10 g protein
70kcal
56kcal
N/A
Weight per 100 calories
58g
111g
N/A
Unsaturated / Saturated Fat ratio
4.6
1.4
N/A
Net carbs
0g
2g
N/A
Sodium
65mg
70mg
0%
Vitamin K
0.1µg
0%
Tryptophan
0.274mg
0%
Threonine
1.073mg
0%
Isoleucine
1.128mg
0%
Leucine
1.989mg
0%
Lysine
2.248mg
0%
Methionine
0.724mg
0%
Phenylalanine
0.955mg
0%
Valine
1.261mg
0%
Histidine
0.721mg
0%
Omega-3 - EPA
0.406g
0.119g
N/A
Omega-3 - DHA
1.206g
0g
N/A
Omega-3 - DPA
0.209g
0.099g
N/A
Macronutrient Comparison
Macronutrient breakdown side-by-side comparison
3
24%
8%
65%
3%
Protein:
24.47 g
Fats:
7.51 g
Carbs:
0 g
Water:
65.09 g
Other:
2.93 g
2
16%
2%
79%
Protein:
16.1 g
Fats:
1.4 g
Carbs:
2 g
Water:
79.2 g
Other:
1.3 g
Contains
more
Protein Protein
+52%
Contains
more
Fats Fats
+436.4%
Contains
more
Other Other
+125.4%
Contains
more
Carbs Carbs
+∞%
Contains
more
Water Water
+21.7%
Fat Type Comparison
Fat type breakdown side-by-side comparison
2
18%
40%
43%
Saturated fat:
Sat. Fat
1.162 g
Monounsaturated fat:
Mono. Fat
2.559 g
Polyunsaturated fat:
Poly. Fat
2.755 g
1
41%
30%
29%
Saturated fat:
Sat. Fat
0.361 g
Monounsaturated fat:
Mono. Fat
0.259 g
Polyunsaturated fat:
Poly. Fat
0.252 g
Contains
more
Mono. Fat Monounsaturated fat
+888%
Contains
more
Poly. Fat Polyunsaturated fat
+993.3%
Contains
less
Sat. Fat Saturated fat
-68.9%