Caviar Nutrition & Calories – Complete Data of All Nutrients

Introduction
Although caviar isn't a typical everyday meal, it's considered a luxurious seafood delicacy. We'll go through the nutritional values and essential micronutrients of caviar.
Table of contents
What is Caviar?
Caviar is the roe or eggs of various species of sturgeon fish. Osetra, Beluga, Kaluga, Sevruga, and Sterlet are the most common species. Although female fish lay eggs, only sturgeon eggs are considered caviar. Other fish eggs, such as salmon, trout, and flying fish, are known as "roe": they are a popular and less expensive alternative to caviar.
In this article, we will solely focus on the nutritional composition of caviar. To learn more about the history of caviar, its varieties, as well as the proper way to prepare, eat, and store it, check out our article on the topic – Caviar: Varieties, Consumption, Storage, and Taste.
Nutrition
This section of the article will discuss uses in different diets and nutrition of black and red granular caviar (vitamins, minerals, micronutrients).
Caviar has a rich nutritional profile, even if consumed in small amounts.
The serving size is usually one tablespoon or approximately 16 grams.
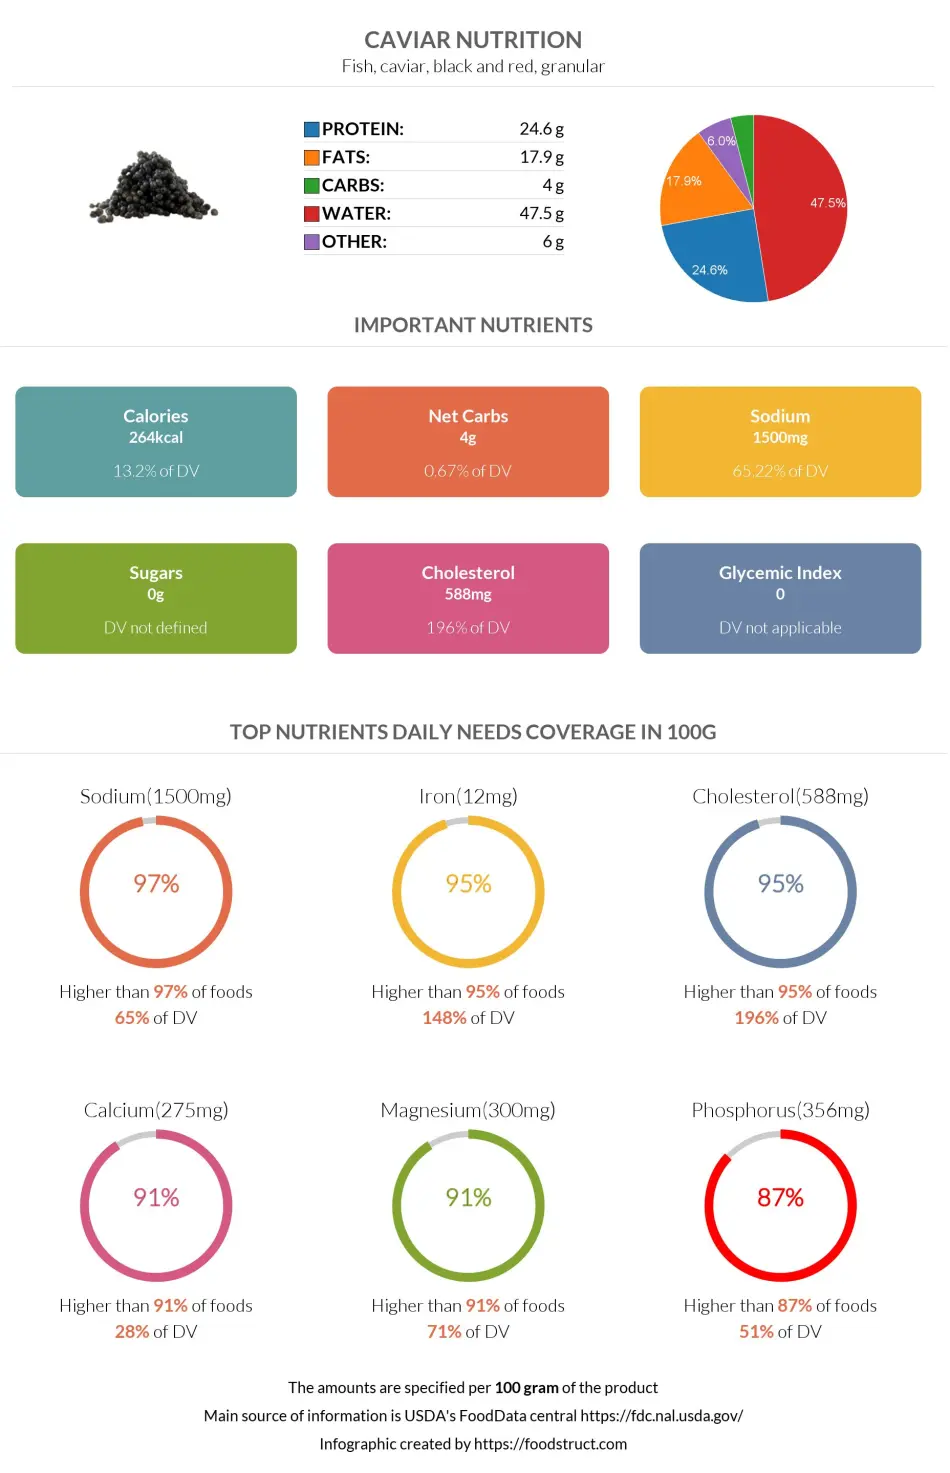
Caviar consists of 48% water, 25% protein, and 18% fats, as depicted in the macronutrient composition chart below.
Macronutrients chart
Make sure to also read our article on the health benefits of caviar to learn more about how its rich nutritional profile affects your health.
Calories
100g of caviar provides 264 calories, and one average serving (16g) of caviar provides only 42 calories.
Hence, caviar contains moderate to low calories. Since caviar is packed with rich nutrients, it is a great choice for weight loss diets. Learn more about how caviar fits into popular weight loss diets in our article.
Carbohydrates
Caviar contains only a few grams of carbs: 4g per 100-gram serving, and all the carbs are net carbs. To learn more about how caviar fits into the keto diet, check our article – Caviar and Keto Diet - Is It Keto-Friendly.
Protein
Proteins are responsible for nutrient processing, aiding in the proper movement of body parts, providing immune protection, and assisting in the regulation of hormone synthesis.
Caviar is rich in high-quality protein. It provides 4g of protein per serving and 24.6 g per 100g accordingly.
Caviar falls in the range of the top 13% of foods as a source of protein.
Caviar is relatively high in all 9 essential amino acids – tryptophan, threonine, isoleucine, phenylalanine, valine, histidine, lysine, leucine, and methionine. It also contains other amino acids, such as arginine, cystine, tyrosine, glutamic acid, serine, alanine, glycine, proline, and aspartic acid.
Caviar also contains a high concentration of protein fractions such as vitellin and phosvitin. Small proteins, possibly lysozyme or phosvitin, are also present in salmon roe.
Protein quality breakdown
Fats
Caviar has a high amount of good fats. It falls in the range of the top 18% of foods as a source of fats, containing 25.6g per 100g; this is two times higher than the fat content of broccoli.
Of these fats, 4.06g is saturated, 4.6g is monounsaturated, and 7.4g is polyunsaturated.
Moreover, caviar is rich in omega-3 fatty acids along with large amounts of eicosapentaenoic acid and docosahexaenoic acid, which can help to support the nervous system, immune system, and circulatory system health.
Caviar contains no trans fats.
Fat type information
Cholesterol
Caviar contains a high level of cholesterol. It falls in the range of the top 5% of foods as a source of cholesterol.
One serving of caviar can cover 30% of your daily cholesterol need.
There are two types of cholesterol: high-density lipoproteins (HDL) and low-density lipoproteins (LDL). HDL is considered to be healthy, whereas LDL is considered to be unhealthy. Caviars’ cholesterol is LDL, but the omega-3 fatty acids can significantly reduce triglycerides and raise HDL levels – “the good” cholesterol. Please also note if you have any cardiovascular issues, it is recommended to consume caviar in moderation to control the cholesterol intake.
Organic Acids
Caviar contains high concentrations of organic acids such as citric, lactic, and acetic acids. Organic acids can stimulate pancreatic enzyme secretion, reduce gastric pH, inhibit pathogens, and serve as an energy source during GI-tract intermediary metabolism (1).
Vitamins
Caviar is an excellent source of vitamins, especially B-complex vitamins and Vitamin D. Pyridoxine (B6), riboflavin (B2), cyanocobalamin (B12), and pantothenic acid (B5) are the predominant vitamins in caviar.
All B-complex vitamins aid the body's energy production by converting carbohydrates into glucose.
Caviar falls in the top 14% of foods as a source of Vitamin B12.
One serving of caviar (16 grams) packs more than double your daily requirement of Vitamin B12.
One serving of caviar can also cover 20% of your daily Vitamin B5 need. Caviar is an excellent source of Vitamin B2, providing about 0.62mg per 100 g. It falls in the range of the top 13% of foods as a source of Vitamin B2.
Caviar also provides Vitamin A, Vitamin E, Vitamin B1 (Thiamine), and folate in moderate amounts. It is lowest in Vitamin B3 (niacin) and Vitamin C, and it completely lacks Vitamin C.
Vitamin coverage chart
Minerals
Caviar has a rich mineral profile. It contains high amounts of magnesium (300mg per 100g), phosphorus (275mg per 100g), calcium (275mg per 100g), selenium (65.5µg), iron (11.88mg per 100g), and choline (491mg per 100g).
Caviar falls in the range of the top 5% and 9% of foods as a source of iron, magnesium, and calcium.
Caviar contains 2.2 times more calcium than milk and 4.6 times more iron than beef per 100-gram serving, although caviar is usually consumed in smaller amounts.
One serving of caviar can cover 30% of your daily iron need.
Caviar also provides moderate amounts of manganese and copper.
It is important to note that caviar contains high amounts of sodium, more than 97% of foods. One serving (16 grams) of caviar contains 240mg of sodium. Too much sodium intake can cause stroke, heart failure, osteoporosis, stomach cancer, and kidney disease. So, it is better to consume caviar in moderation.
Mineral coverage chart
Glycemic Index
Based on the low level of carbohydrates, caviar can be considered a 0 glycemic index. You can also visit our Glycemic index chart page for glycemic index values of 600+ pages.
Acidity
Caviars are acidic. The pH value of caviar falls in the range of 4.8 to 5. The acidity of caviar can also be measured by looking at its potential renal acid load or PRAL value. Caviar has a PRAL value of 10.1, making it an acid-producing food.
Purines in Caviar
Purines are natural substances that, when metabolized, form uric acids. Eating foods high in purines may cause uric acid to accumulate in the body, putting the individual at risk for various illnesses, including gout.
Kaneko et al. determined that caviar contains 94.7 mg of purines per 100-gram serving, classifying it within the low to moderate range of purine content (2).
Wild-Caught vs. Farmed Sturgeon Caviar: A Nutritional Comparison
In a study by Wirth et al., the authors compared the nutritional compositions of caviar sourced from 22 wald-caught and 2 farmed sturgeon specimens (3). The authors found that caviar obtained from farmed sturgeon had lower protein and lipid levels than caviar obtained from wild-caught surgeons.
Caviar samples from farmed sturgeons also had higher levels of linoleic acid and lower levels of arachidonic acid; however, the proportion of n-3/n-6 PUFAs (polyunsaturated fatty acids) was similar in wild-caught and farmed sturgeon caviar. Moreover, one of the samples from the farmed sturgeons was found to have the lowest concentration of DDT.
A different study found that although differences existed between the caviar sourced from farmed and wild-caught sturgeons, they did not significantly impact the overall quality of the caviar (4). The authors concluded that caviar from farmed sturgeon may be a more sustainable source.
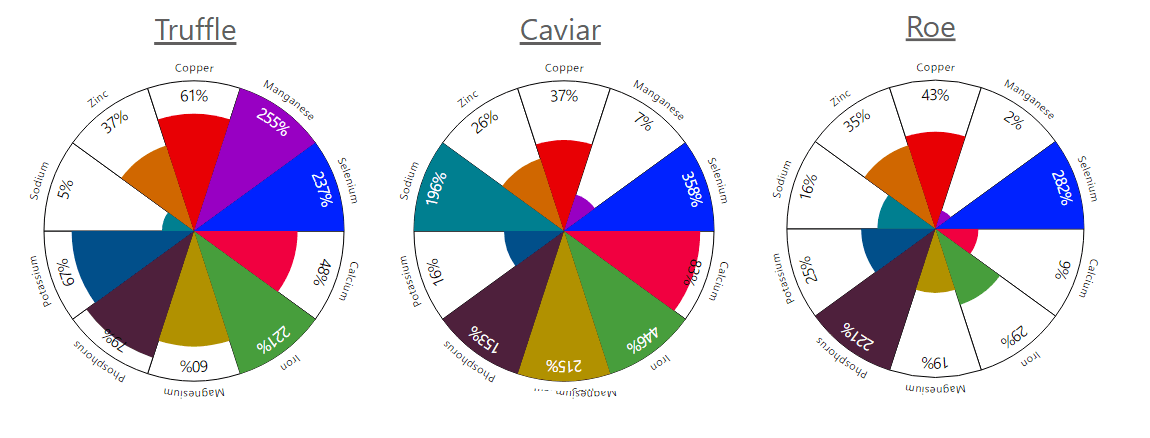
Comparison to Similar Foods
We compared caviar to other foods in our database and highlighted which one contains more macronutrients.
Compared with roe, caviar is higher in Vitamin B12, iron, magnesium, Vitamin B5, selenium, and calcium.
When it comes to truffles, caviar provides more iron, Vitamin B5, magnesium, and selenium.
References
- https://pubmed.ncbi.nlm.nih.gov/32349203/
- https://www.jstage.jst.go.jp/article/bpb/37/5/37_b13-00967/_html/-char/en
- https://pubmed.ncbi.nlm.nih.gov/10996895/
- http://www.spgykj.com/article/doi/10.13386/j.issn1002-0306.2014.10.068?pageType=en

Important nutritional characteristics for Caviar
| Glycemic index ⓘ Caviar can be considered as a 0 glycemic index food as it does not have carbs. Source: https://foodstruct.com/articles/glycemic-index-of-0-no-carb-foods | 0 (low) |
| Calories ⓘ Calories per 100-gram serving | 264 |
| Net Carbs ⓘ Net Carbs = Total Carbohydrates – Fiber – Sugar Alcohols | 4 grams |
| Serving Size ⓘ Serving sizes are taken from FDA's Reference Amounts Customarily Consumed (RACCs) | 1 tbsp (16 grams) |
| Acidity (Based on PRAL) ⓘ PRAL (Potential renal acid load) is calculated using a formula. On the PRAL scale the higher the positive value, the more is the acidifying effect on the body. The lower the negative value, the higher the alkalinity of the food. 0 is neutral. | 10.1 (acidic) |
Caviar calories (kcal)
| Serving Size | Calories | Weight |
|---|---|---|
| Calories in 100 grams | 264 | |
| Calories in 1 tbsp | 42 | 16 g |
| Calories in 1 oz | 75 | 28.35 g |
Caviar Glycemic index (GI)
Mineral chart - relative view
Vitamin chart - relative view
All nutrients for Caviar per 100g
| Nutrient | Value | DV% | In TOP % of foods | Comparison |
| Calories | 264kcal | 13% | 35% |
5.6 times more than Orange
|
| Protein | 24.6g | 59% | 13% |
8.7 times more than Broccoli
|
| Fats | 17.9g | 28% | 18% |
1.9 times less than Cheddar Cheese
|
| Vitamin C | 0mg | 0% | 100% |
N/A
|
| Net carbs | 4g | N/A | 60% |
13.5 times less than Chocolate
|
| Carbs | 4g | 1% | 63% |
7 times less than Rice
|
| Cholesterol | 588mg | 196% | 5% |
1.6 times more than Egg
|
| Vitamin D | 2.9µg | 29% | 41% |
1.3 times more than Egg
|
| Iron | 11.88mg | 149% | 5% |
4.6 times more than Beef broiled
|
| Calcium | 275mg | 28% | 9% |
2.2 times more than Milk
|
| Potassium | 181mg | 5% | 64% |
1.2 times more than Cucumber
|
| Magnesium | 300mg | 71% | 9% |
2.1 times more than Almond
|
| Sugar | 0g | N/A | 100% |
N/A
|
| Fiber | 0g | 0% | 100% |
N/A
|
| Copper | 0.11mg | 12% | 48% |
1.3 times less than Shiitake
|
| Zinc | 0.95mg | 9% | 55% |
6.6 times less than Beef broiled
|
| Phosphorus | 356mg | 51% | 13% |
2 times more than Chicken meat
|
| Sodium | 1500mg | 65% | 3% |
3.1 times more than White Bread
|
| Vitamin A | 905IU | 18% | 20% |
18.5 times less than Carrot
|
| Vitamin A RAE | 271µg | 30% | 24% | |
| Vitamin E | 1.89mg | 13% | 41% |
1.3 times more than Kiwifruit
|
| Selenium | 65.5µg | 119% | 21% | |
| Manganese | 0.05mg | 2% | 66% | |
| Vitamin B1 | 0.19mg | 16% | 35% |
1.4 times less than Pea raw
|
| Vitamin B2 | 0.62mg | 48% | 13% |
4.8 times more than Avocado
|
| Vitamin B3 | 0.12mg | 1% | 90% |
79.8 times less than Turkey meat
|
| Vitamin B5 | 3.5mg | 70% | 27% |
3.1 times more than Sunflower seed
|
| Vitamin B6 | 0.32mg | 25% | 38% |
2.7 times more than Oat
|
| Vitamin B12 | 20µg | 833% | 14% |
28.6 times more than Pork
|
| Vitamin K | 0.6µg | 1% | 80% |
169.3 times less than Broccoli
|
| Folate | 50µg | 13% | 35% |
1.2 times less than Brussels sprout
|
| Saturated Fat | 4.06g | 20% | 30% |
1.5 times less than Beef broiled
|
| Monounsaturated Fat | 4.63g | N/A | 33% |
2.1 times less than Avocado
|
| Polyunsaturated fat | 7.41g | N/A | 14% |
6.4 times less than Walnut
|
| Tryptophan | 0.32mg | 0% | 47% |
1.1 times more than Chicken meat
|
| Threonine | 1.26mg | 0% | 46% |
1.8 times more than Beef broiled
|
| Isoleucine | 1.04mg | 0% | 57% |
1.1 times more than Salmon raw
|
| Leucine | 2.13mg | 0% | 51% |
1.1 times less than Tuna Bluefin
|
| Lysine | 1.83mg | 0% | 60% |
4.1 times more than Tofu
|
| Methionine | 0.65mg | 0% | 54% |
6.7 times more than Quinoa
|
| Phenylalanine | 1.07mg | 0% | 51% |
1.6 times more than Egg
|
| Valine | 1.26mg | 0% | 53% |
1.6 times less than Soybean raw
|
| Histidine | 0.65mg | 0% | 62% |
1.2 times less than Turkey meat
|
| Omega-3 - EPA | 2.74g | N/A | 32% |
4 times more than Salmon
|
| Omega-3 - DHA | 3.8g | N/A | 32% |
2.6 times more than Salmon
|
| Omega-3 - DPA | 0.23g | N/A | 33% |
1.3 times more than Salmon
|
Check out similar food or compare with current
NUTRITION FACTS LABEL
Serving Size ______________
Health checks
Caviar nutrition infographic
References
All the values for which the sources are not specified explicitly are taken from FDA’s Food Central. The exact link to the food presented on this page can be found below.