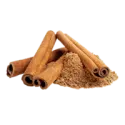
Cinnamon nutrition: calories, carbs, GI, protein, fiber, fats
Carbs in Cinnamon
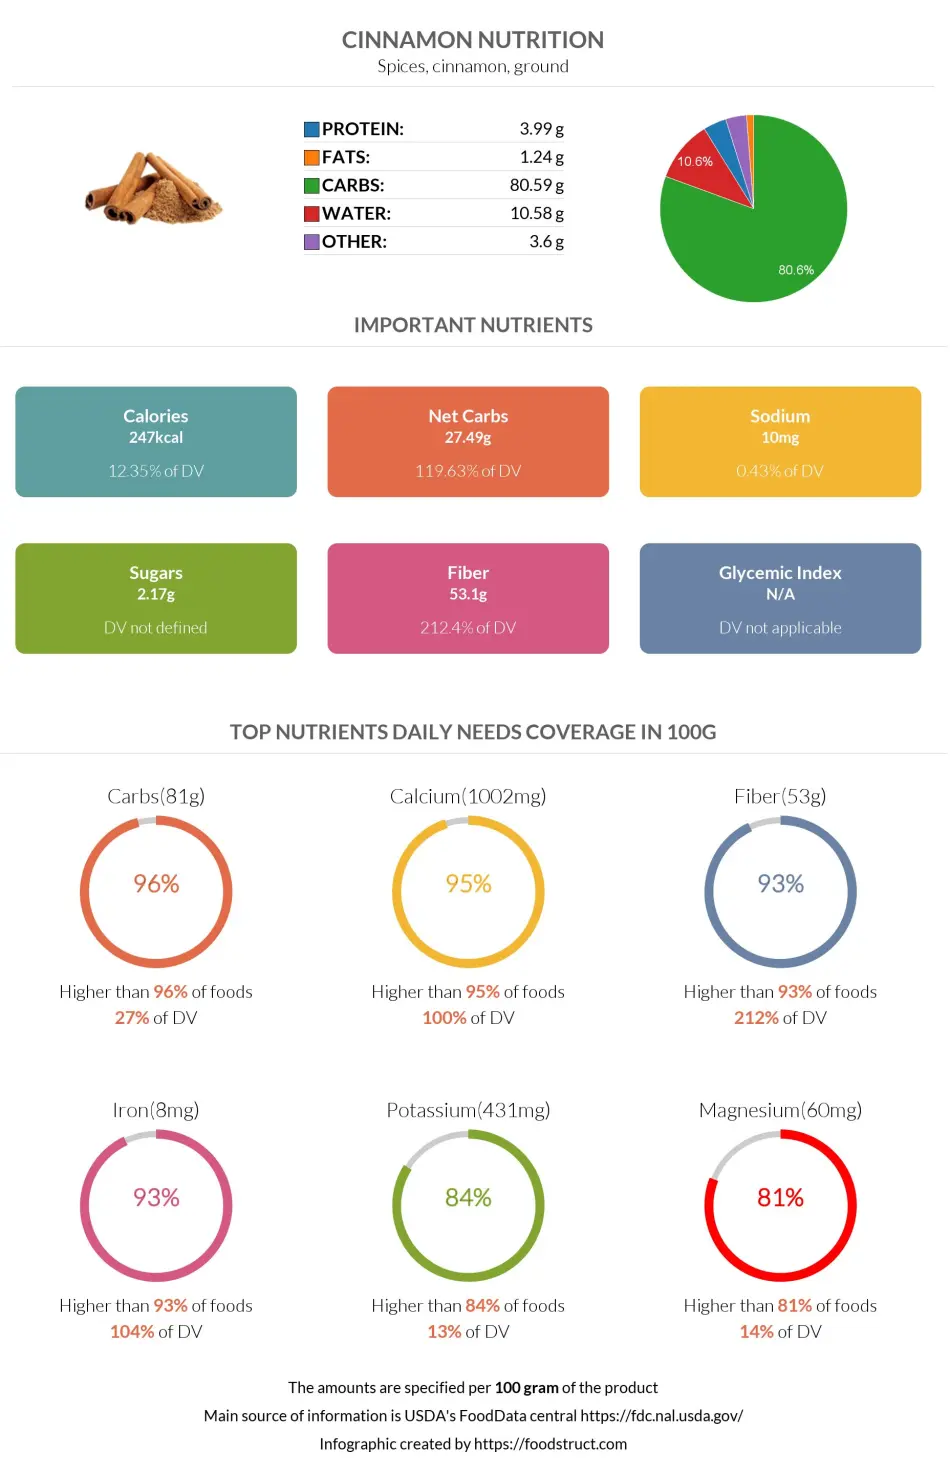
Ground cinnamon has 80.6g of carbohydrates per 100g. This amount provides 27% of the daily carbohydrate requirement.
In terms of carbs, cinnamon is higher than 96% of foods.
Macronutrients chart
Carbs per serving size
The serving size for this food is one teaspoon, which weighs 2.6g. Cinnamon contains 2.1g carbs per serving size.
Carbohydrate type breakdown
There is approximately 2.2g of sugar in 100g of cinnamon. Nearly half of the sugars are glucose, as shown in the chart below. Fructose makes up the other half: the fructose content equals 1.1g. Sucrose levels are so low that we can ignore them.
Carbohydrate type breakdown
Cinnamon net carbs
Ground cinnamon has 53.1 grams of fiber out of 80.6 grams of carbs. Therefore, there are 27.5g net carbs in this food.
Fiber content ratio for Cinnamon
Cinnamon calories
Cinnamon is an average-calorie food with 247 calories per 100g. The majority of these calories come from the carb content. 100g of ground cinnamon provides 12.35% of the daily need for calories.
Calories per serving size
The serving size for the cinnamon is one teaspoon (2.6g). This amount contains 6.4 calories.
Comparison
Cinnamon is higher in calories than 61% of foods. However, it is lower in calories than most spices.
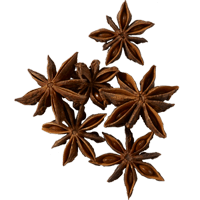
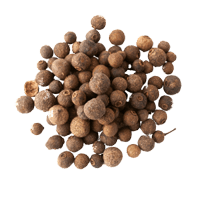
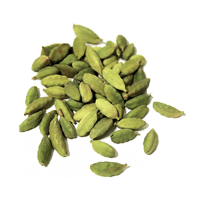
Cinnamon is lower in calories than Star anise and Allspice. It has fewer calories than Cardamom.
The calorie content of cinnamon and some other spices are shown below.
| Food | Calories per 100 grams |
| Cumin | 375 |
| Star anise | 337 |
| Fenugreek | 323 |
| Cardamom | 311 |
| Chili powder spice | 282 |
| Allspice | 263 |
| Cinnamon | 247 |
Burning estimates
The table below illustrates how long it takes to burn 6.4 calories (1 teaspoon of cinnamon) and the required activity. The time was calculated using the MET method (Metabolic Equivalent of a Task) (1) (2).
| One teaspoon - 70kg per person | One teaspoon - 100kg per person | |
| Walking | 2 min | 2 min |
| Running | 1 min | < 1 min |
| Cycling | 1 min | < 1 min |
Cinnamon glycemic index
Cinnamon consists of 80% carbohydrates, of which the pressing majority is made up of dietary fiber. One serving size of ground cinnamon contains less than 0.1g of sugars. For that reason, the cinnamon spice has a very low glycemic index.
Cinnamon supplementation with a high glycemic index meal can significantly reduce the elevation of blood glucose by lowering the starch conversion into glucose (1). White bread has a high glycemic index of 100. After adding 2.5% cinnamon to the bread, the glycemic index is lowered to 63±7 (3).
In addition to the low glycemic index, cinnamon was also found to have beneficial effects on health. Research has found that cinnamon consumption may improve anthropometric parameters, glycemic indices, and lipid profile of individuals with type 2 diabetes mellitus (4).
Cinnamon tea intake also helps improve blood glucose levels in patients with type 2 diabetes (5).
In summary, cinnamon consumption can be recommended for individuals with diabetes, as it can contribute notable anti-diabetic qualities.
References
- https://www.ncbi.nlm.nih.gov/pmc/articles/PMC4428382/
- 2011 Compendium of Physical Activities
- http://www.als-journal.com/712-19/
- https://europepmc.org/article/med/24199490
- https://pubmed.ncbi.nlm.nih.gov/29605574/
- https://www.researchgate.net/publication/341642135

Important nutritional characteristics for Cinnamon
|
Glycemic index ⓘ
Source: 74 with glucose (glucose 100) http://www.als-journal.com/712-19/
Check out our Glycemic index chart page for the full list.
|
N/A (-) |
| Calories ⓘ Calories per 100-gram serving | 247 |
| Net Carbs ⓘ Net Carbs = Total Carbohydrates – Fiber – Sugar Alcohols | 27.49 grams |
| Serving Size ⓘ Serving sizes are taken from FDA's Reference Amounts Customarily Consumed (RACCs) | 0.25 tsp (0.5 grams) |
| Acidity (Based on PRAL) ⓘ PRAL (Potential renal acid load) is calculated using a formula. On the PRAL scale the higher the positive value, the more is the acidifying effect on the body. The lower the negative value, the higher the alkalinity of the food. 0 is neutral. | -19.3 (alkaline) |
| Oxalates ⓘ https://www.researchgate.net/publication/223973698 | 3460mg |
Cinnamon calories (kcal)
| Serving Size | Calories | Weight |
|---|---|---|
| Calories in 100 grams | 247 | |
| Calories in 0.25 tsp | 1 | 0.5 g |
| Calories in 1 tbsp | 19 | 7.8 g |
Cinnamon Glycemic index (GI)
Mineral coverage chart
Mineral chart - relative view
Vitamin coverage chart
Vitamin chart - relative view
Protein quality breakdown
Fat type information
All nutrients for Cinnamon per 100g
| Nutrient | Value | DV% | In TOP % of foods | Comparison |
| Calories | 247kcal | 12% | 39% |
5.3 times more than Orange
|
| Protein | 3.99g | 10% | 66% |
1.4 times more than Broccoli
|
| Fats | 1.24g | 2% | 72% |
26.9 times less than Cheddar Cheese
|
| Vitamin C | 3.8mg | 4% | 31% |
13.9 times less than Lemon
|
| Net carbs | 27.49g | N/A | 27% |
2 times less than Chocolate
|
| Carbs | 80.59g | 27% | 4% |
2.9 times more than Rice
|
| Cholesterol | 0mg | 0% | 100% |
N/A
|
| Vitamin D | 0µg | 0% | 100% |
N/A
|
| Iron | 8.32mg | 104% | 7% |
3.2 times more than Beef broiled
|
| Calcium | 1002mg | 100% | 5% |
8 times more than Milk
|
| Potassium | 431mg | 13% | 16% |
2.9 times more than Cucumber
|
| Magnesium | 60mg | 14% | 19% |
2.3 times less than Almond
|
| Sugar | 2.17g | N/A | 59% |
4.1 times less than Coca-Cola
|
| Fiber | 53.1g | 212% | 7% |
22.1 times more than Orange
|
| Copper | 0.34mg | 38% | 24% |
2.4 times more than Shiitake
|
| Zinc | 1.83mg | 17% | 41% |
3.4 times less than Beef broiled
|
| Phosphorus | 64mg | 9% | 73% |
2.8 times less than Chicken meat
|
| Sodium | 10mg | 0% | 85% |
49 times less than White Bread
|
| Vitamin A | 295IU | 6% | 29% |
56.6 times less than Carrot
|
| Vitamin A RAE | 15µg | 2% | 46% | |
| Vitamin E | 2.32mg | 15% | 39% |
1.6 times more than Kiwifruit
|
| Selenium | 3.1µg | 6% | 72% | |
| Manganese | 17.47mg | 759% | 25% | |
| Vitamin B1 | 0.02mg | 2% | 86% |
12.1 times less than Pea raw
|
| Vitamin B2 | 0.04mg | 3% | 83% |
3.2 times less than Avocado
|
| Vitamin B3 | 1.33mg | 8% | 64% |
7.2 times less than Turkey meat
|
| Vitamin B5 | 0.36mg | 7% | 69% |
3.2 times less than Sunflower seed
|
| Vitamin B6 | 0.16mg | 12% | 54% |
1.3 times more than Oat
|
| Vitamin B12 | 0µg | 0% | 100% |
N/A
|
| Vitamin K | 31.2µg | 26% | 45% |
3.3 times less than Broccoli
|
| Folate | 6µg | 2% | 76% |
10.2 times less than Brussels sprout
|
| Trans Fat | 0g | N/A | 100% |
N/A
|
| Saturated Fat | 0.35g | 2% | 73% |
17.1 times less than Beef broiled
|
| Monounsaturated Fat | 0.25g | N/A | 77% |
39.8 times less than Avocado
|
| Polyunsaturated fat | 0.07g | N/A | 88% |
693.7 times less than Walnut
|
| Tryptophan | 0.05mg | 0% | 86% |
6.2 times less than Chicken meat
|
| Threonine | 0.14mg | 0% | 87% |
5.3 times less than Beef broiled
|
| Isoleucine | 0.15mg | 0% | 88% |
6.3 times less than Salmon raw
|
| Leucine | 0.25mg | 0% | 88% |
9.6 times less than Tuna Bluefin
|
| Lysine | 0.24mg | 0% | 83% |
1.9 times less than Tofu
|
| Methionine | 0.08mg | 0% | 85% |
1.2 times less than Quinoa
|
| Phenylalanine | 0.15mg | 0% | 88% |
4.6 times less than Egg
|
| Valine | 0.22mg | 0% | 86% |
9.1 times less than Soybean raw
|
| Histidine | 0.12mg | 0% | 85% |
6.4 times less than Turkey meat
|
| Fructose | 1.11g | 1% | 86% |
5.3 times less than Apple
|
| Omega-3 - EPA | 0g | N/A | 100% |
N/A
|
| Omega-3 - DHA | 0g | N/A | 100% |
N/A
|
| Omega-3 - ALA | 0.01g | N/A | 97% |
830.9 times less than Canola oil
|
| Omega-3 - DPA | 0g | N/A | 100% |
N/A
|
| Omega-6 - Gamma-linoleic acid | 0g | N/A | 100% | |
| Omega-6 - Eicosadienoic acid | 0g | N/A | 100% |
Check out similar food or compare with current
NUTRITION FACTS LABEL
Serving Size ______________
Health checks
Cinnamon nutrition infographic
References
All the values for which the sources are not specified explicitly are taken from FDA’s Food Central. The exact link to the food presented on this page can be found below.